Introduction
In this guide to Overall Equipment Effectiveness (OEE), you’ll learn what it is, and why it is has become an industry standard for manufacturers. We also lead you through a breakdown of the OEE calculation and it’s components. Also considered is the difference between OEE, OOE and TEEP; and which one is best for measuring your own production processes. Then answers are given as to what is a good OEE score before concluding with 6 tips as to how OEE can be implemented.
Why is OEE important?
Production facilities are expensive, and investors want to see a good return. If production equipment is sitting idle, not being used to its full capacity or not producing products to specification, then a return on investment is going to take longer. Monitoring the Overall Equipment Effectiveness is a valuable KPI for plant managers to access how well the production facilities are being utilized, and how much capacity is being lost.
Furthermore it allows plant managers to benchmark how well their facility it being operated, identify losses and work to eliminate them, thereby reducing costs and increasing profitability.
How is OEE calculated?
OEE is calculated with the following formula:
OEE = Availability x Performance x Quality
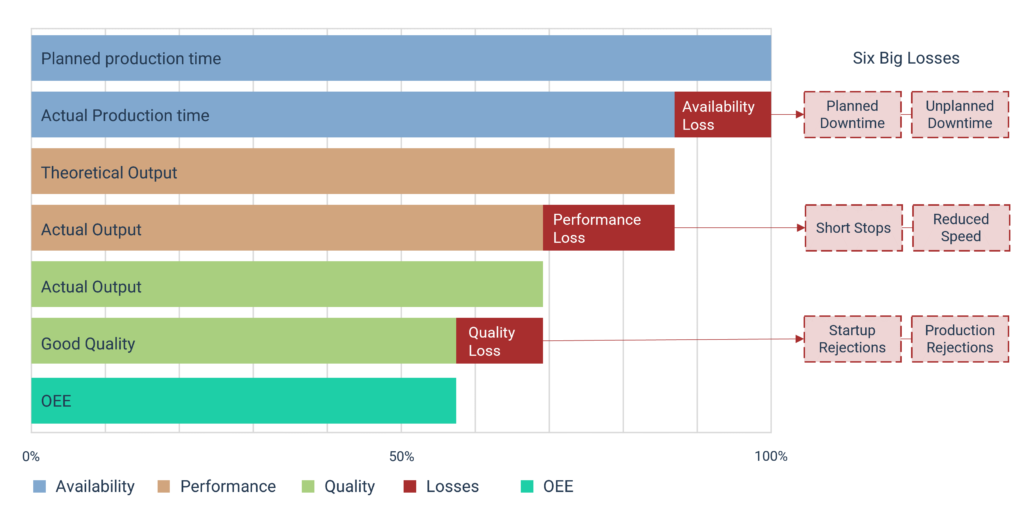
An OEE score of 100% means that for the planned production time, the equipment is constantly working at optimum speed and produces only good quality products. There is therefore no downtime, short stops, loss of speed or defective products.
Now let’s break this down formula and consider how each of these components are defined, calculated, relate to the Six Big Losses, how they can be measured and their significance upon business.
Availability – how much are machines actually working?
Availability is defined as the time machines actually worked, compared to the planned production time.
It is calculated by dividing the actual production time by the planned production time and multiplying this by 100 to present the metric as a percentage.
Actual Production time / Planned production time * 100 = Availability %
The loss in availability can be categorized as either planned or unplanned downtime, which are two of the Six Big Losses. Planned downtime relates to setups and adjustments of machinery, whilst unplanned downtime refers to machine breakdowns.
So, an availability of 100% means that there is not a moment during planned production time that the machinery is sitting idle.
Generally speaking, availability is the least complicated of the three elements of OEE to measure – equipment is either running or not.
In most manufacturing companies, unplanned downtime due to require repair and maintenance can quickly erode profitability and margins, and because of production delays can negatively impact customer satisfaction.
Performance – are machines working fast enough?
Performance is defined as the actual production output, compared to what the machinery is theoretically capable of producing during the actual production time (see availability). The actual production output at this point includes any rejects or rework.
It is calculated by dividing the actual production output during the actual production time by the potential production output during the actual production time. This is then multiplied by 100 to present the metric as a percentage.
Calculating the theoretical production output can be found by multiplying the speed as recommended by the machine’s manufacturer by the actual production time.
Actual production output during the actual production time / potential production output during the actual production time * 100 = Performance %
A performance of 100% would mean that during the actual production time, the machines never stopped and continually maintained the output speed recommended by their builder.
Performance losses fit into another two of the Six Big Losses, short stops and reduced speed. Many different factors can contribute to variances in performance – the quality of raw materials and parts, environmental conditions, operator training and proficiency, tuning and placement of the machinery, logistics processes and others.
Unless performance becomes so bad that it impacts customer delivery, it may have little impact on customer relationships. However, it can greatly improve or worsen the efficiency and profitability of a manufacturer’s operation.
Quality – does production output comply with specifications?
Quality is defined as the number of specification compliant products produced, compared to all products produced during the actual production time.
It is calculated by dividing the number of specification compliant products produced by the number of actual products produced during the actual production time, and multiplying this by 100 to present the metric as a percentage.
Specification compliant products produced during the actual production time / all products produced during the actual production time * 100 = Quality %
The actual number of products produced should be the same as that used in the performance calculation. The challenge is ensuring that products not meeting the specifications are included in the one value and not in the other. In most cases there is product count sensor at the end of the production line, but products are likely rejected both before and after this sensor.
The loss considered by the quality metric also falls into two categories of the Six Big Losses, which are Startup rejections and Production rejections.
So, a quality of 100% means that everything produced is compliant with the set specifications. Nothing is rejected or reworked.
The impact that quality has upon business is defined by the specifications. In most manufacturing operations, quality also ranges along scales of desirable and sub-par values. In a simple quality assessment scenario, the output must match target dimensions within tolerance limits for deviations. Often, quality is highly consequential for meeting customer needs and for maintaining customer loyalty and satisfaction even before it impacts a company’s bottom line or productivity.
What is the difference between OEE, OOE and TEEP?
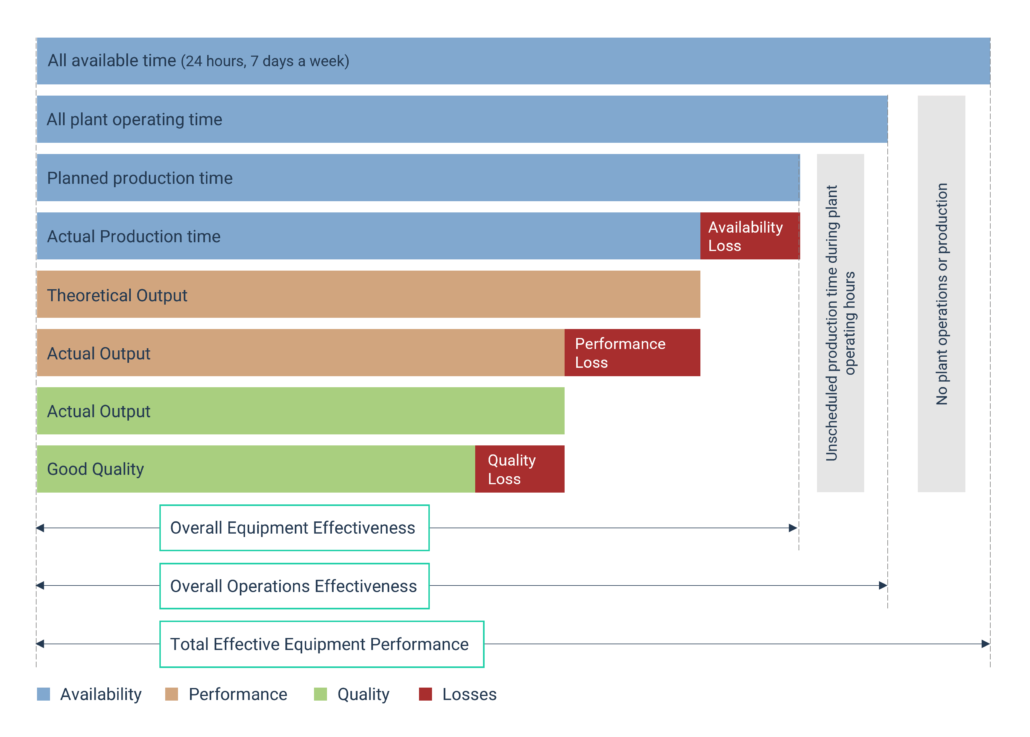
In addition to Overall Equipment Effectiveness (OEE), two other KPIs are sometimes talked about. The most well known is Total Effective Equipment Performance (TEEP) and the lesser known is Overall Operations Effectiveness (OOE).
The difference between OEE, OOE and TEEP lies simply in the definition of ‘available time’ as used in the Availability metric, the rest of the formula remains the same.
OEE
Overall Equipment Effectiveness defines ‘available time’ as the time scheduled for production.
OOE
Overall Operations Effectiveness defines ‘available time’ as all operating time. This subtle difference with OEE, is down to the fact that production is not normally scheduled to run for the full operational hours of the plant. This is to allow for shift and product changeovers etc. So, whilst OEE only considers the shorter planned production time, OOE would normally use the plant operating hours or planned shift times as the available time.
An OOE score of 100% would mean that the production process was constantly running during the plants operating hours, and without any short stops or slowdowns produced only good quality products.
TEEP
Total Effective Equipment Performance defines ‘available time’ as all time. In other words, 24 hours a day, 7 days a week.
A TEEP score of 100% would mean that the production process never stopped day or night, 7 days a week, and without any short stops or slowdowns produced only good quality products.
What is considered a good OEE score?
Perhaps one of the reasons for the success of OEE as an accepted standard is that obtaining 100% means perfection. Since perfection is usually unobtainable, it gives a scale with which to compare how well production operations are being run for different products and industries. Because it is so well established, lots of literature and expertise has been disseminated on the subject of what is a good and bad OEE score.
The following are widely accepted OEE benchmarks:
- 85% and above = This is world class, which few manufacturers achieve.
- 60% – 85% = This is a good target range for manufacturers.
- 40% – 60% = This range is a reasonable OEE score, where many manufacturers find themselves.
- 40% or less = This is really too low, and action needs to be taken to raise OEE.
How to use OEE in Manufacturing operations?
One of the strengths of OEE is the way in which it combines a complex set of metrics into a single high-level value. Managers can measure how well production facilities are being utilized and how much capacity is wasted. But this only makes an impact when it is integrated into management and operational processes.
Here are 6 tips for ensuring OEE has an impact upon your manufacturing operations:
- Get as much data from the machines as possible, and let software do the calculation for you, this saves a lot of tedious work in Excel spreadsheets.
- Follow a 5 Step Lean method to improve OEE.
- Review OEE at regular intervals and compare it with earlier intervals to see if and how it is changing.
- Monitor OEE in real-time so that managers and operators can respond quickly.
- Create transparency and engagement with production line operators by hanging dashboards to give them a feeling of control as they see the impact of their actions.
- Get beyond the OEE score and drilldown into the details of the metrics to see the ratios of the different wastes and their causes.
References:
- Basak, Shreeja, et al. “Reducing production losses in additive manufacturing using overall equipment effectiveness.” Additive Manufacturing 56 (2022): 102904.
- Hung, Yick-Hin, Leon YO Li, and T. C. E. Cheng. “Uncovering hidden capacity in overall equipment effectiveness management.” International Journal of Production Economics 248 (2022): 108494
- Kechaou, Fatma, Sid-Ali Addouche, and Marc Zolghadri. “A comparative study of overall equipment effectiveness measurement systems.” Production Planning & Control (2022): 1-20.

Curious what innius means for your business?
This is Richard, he’s happy to advise you! Please fill out the form and he will be in touch!


