The innius platform revolutionizes industrial data management by offering a suite of cutting-edge applications that cater to the diverse needs of industrial operations. With a range of powerful and user-friendly apps, innius optimizes operations and facilitates data-driven decision-making, empowering users at every level. The platform consists of three main apps: the Admin app, the Insight app, and the Operations app. The Admin app enables configuration and data enrichment, while the Insight app provides accessible data analytics, and the Operations app enables manual data collection.
Comparing the 3 apps
| Admin app | Insight app | Operations app | |
|---|---|---|---|
| Use | Configuration & Data enrichment | Data access | Manual data collection |
| Type | Web based app | Web & mobile based apps available in Google play store and Apple app store | Web based app, designed for laptops and tablets |
| Available languages | English and Dutch | English and Dutch | English, Dutch and French |

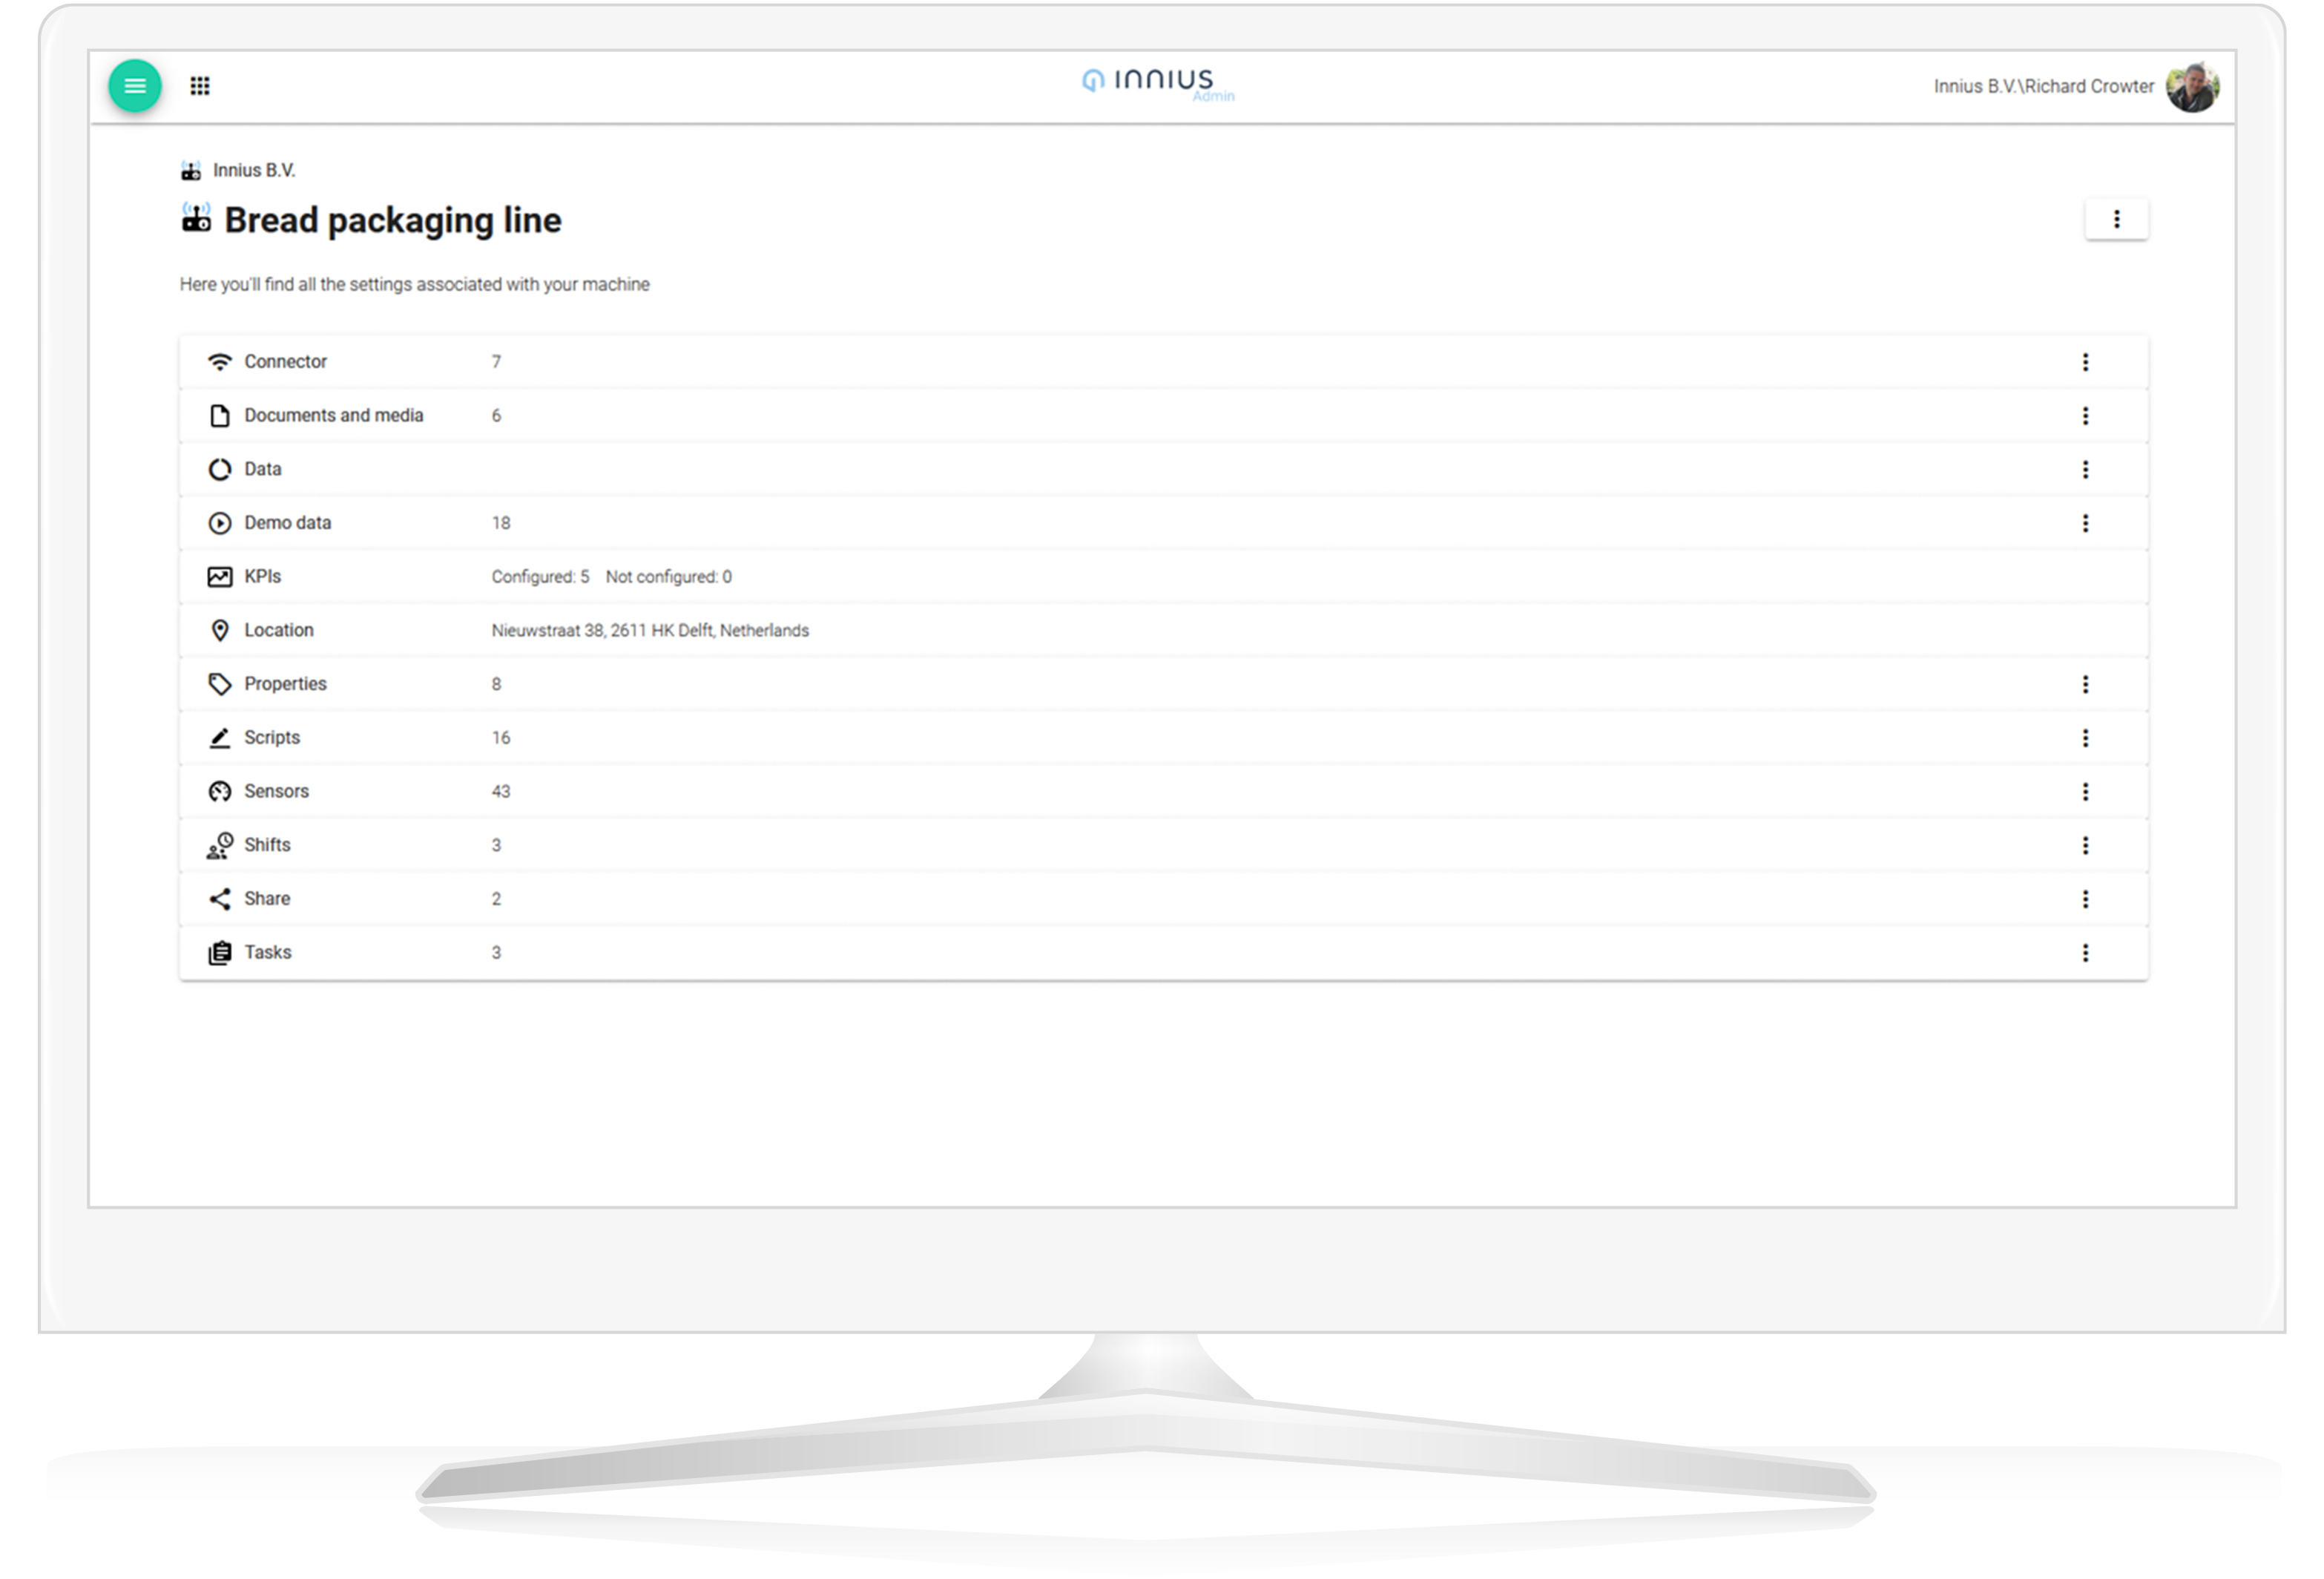
The innius Admin app
As the name suggests this app is for innius admin users only, and where their innius environment is configured. It is accessed via a web browser. Here the company profile and user rights can be managed, along with security settings and the creation of API keys. It is also possible to set up connections with other companies you trust, and choose which machines are visible to them in the Insight app. For example, when a machine user wants the machine builder or maintenance company to monitor the machine as well. The sharing of specific machines can be turned on and off at any time.
Machines and sensors are quickly added to the innius platform in the Admin app. Crucially data can also be enriched here. This means that raw machine data can be made more valuable by adding contextual information from other sources or processing it in some way to answer specific business questions. This can be done by defining thresholds, shifts, batches, recipes, tasks, machine location and integrating Enterprise Application data. Manual sensors for the Operations app and virtual sensors which run on customised scripts to combine data can also be set up. According to our customers, scripts and the virtual sensors they support, is one of the most powerful features of the platform. Industry standard key performance indicators can also be configured here, including:
- Overall Equipment Effectiveness (OEE)
- Mean Time Between Failures (MTBF)
- Mean Time To Repair (MTTR)
- Capacity Utilization (CU)
- Energy Efficiency (EE)

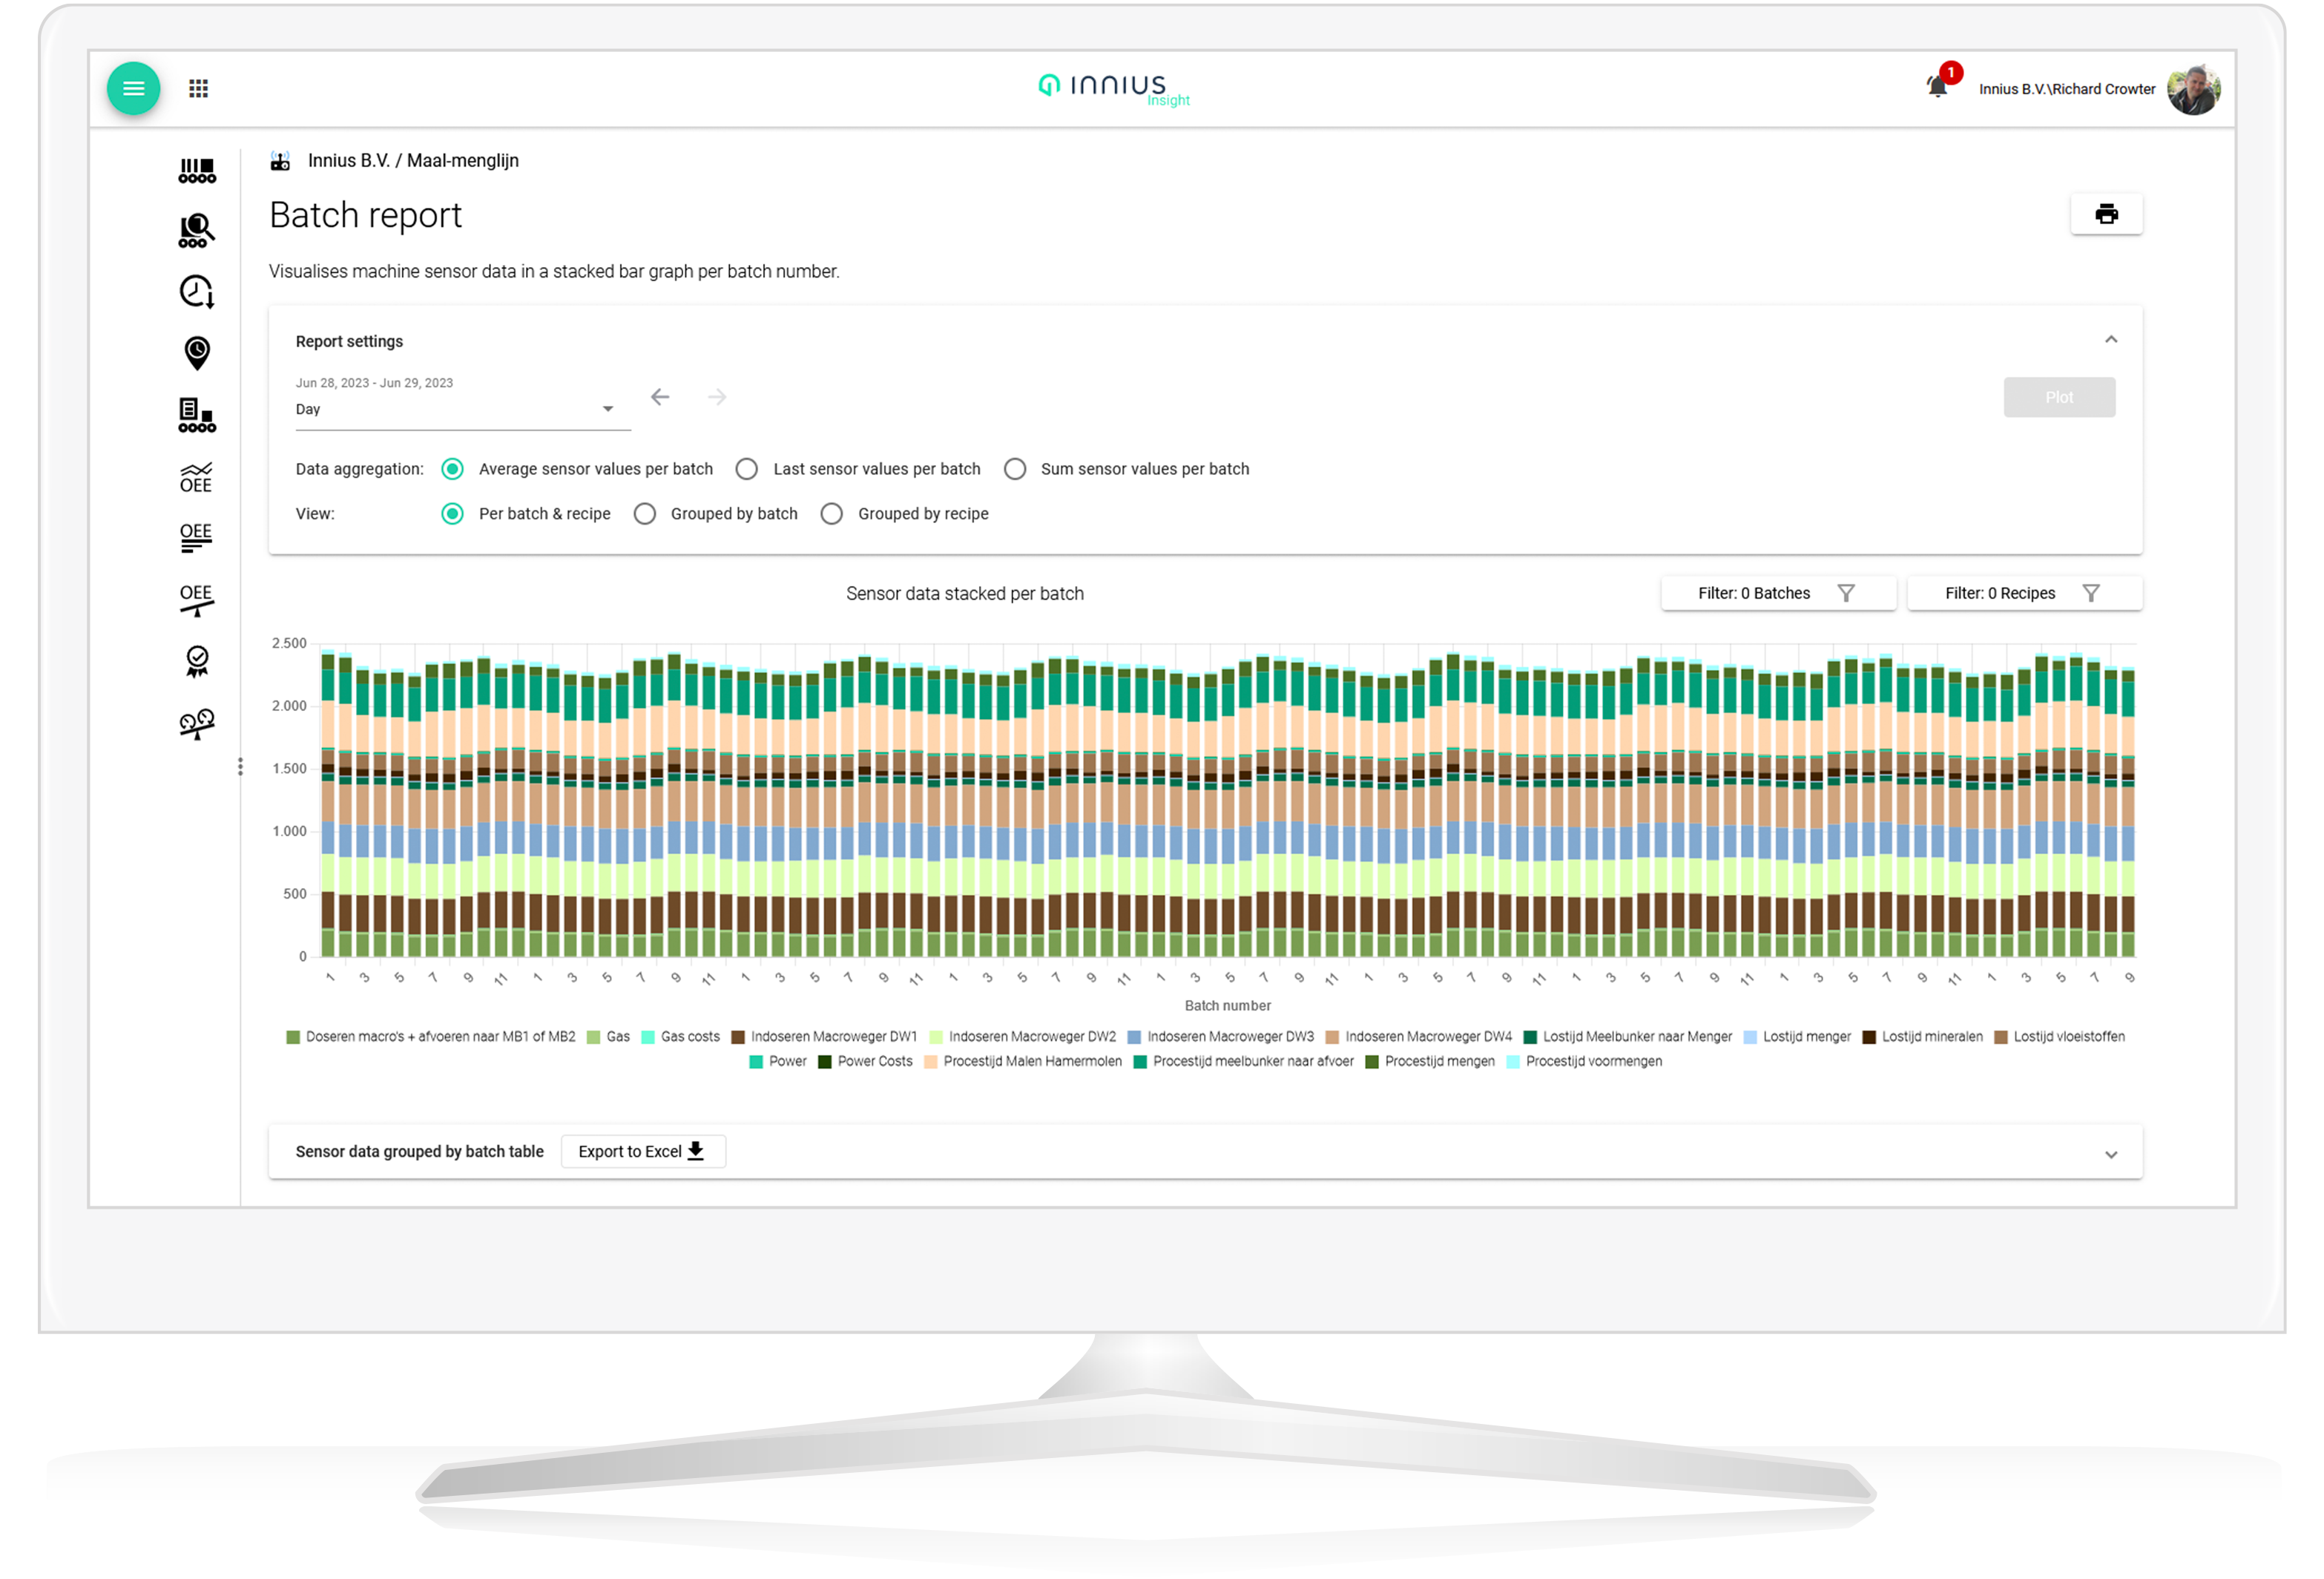
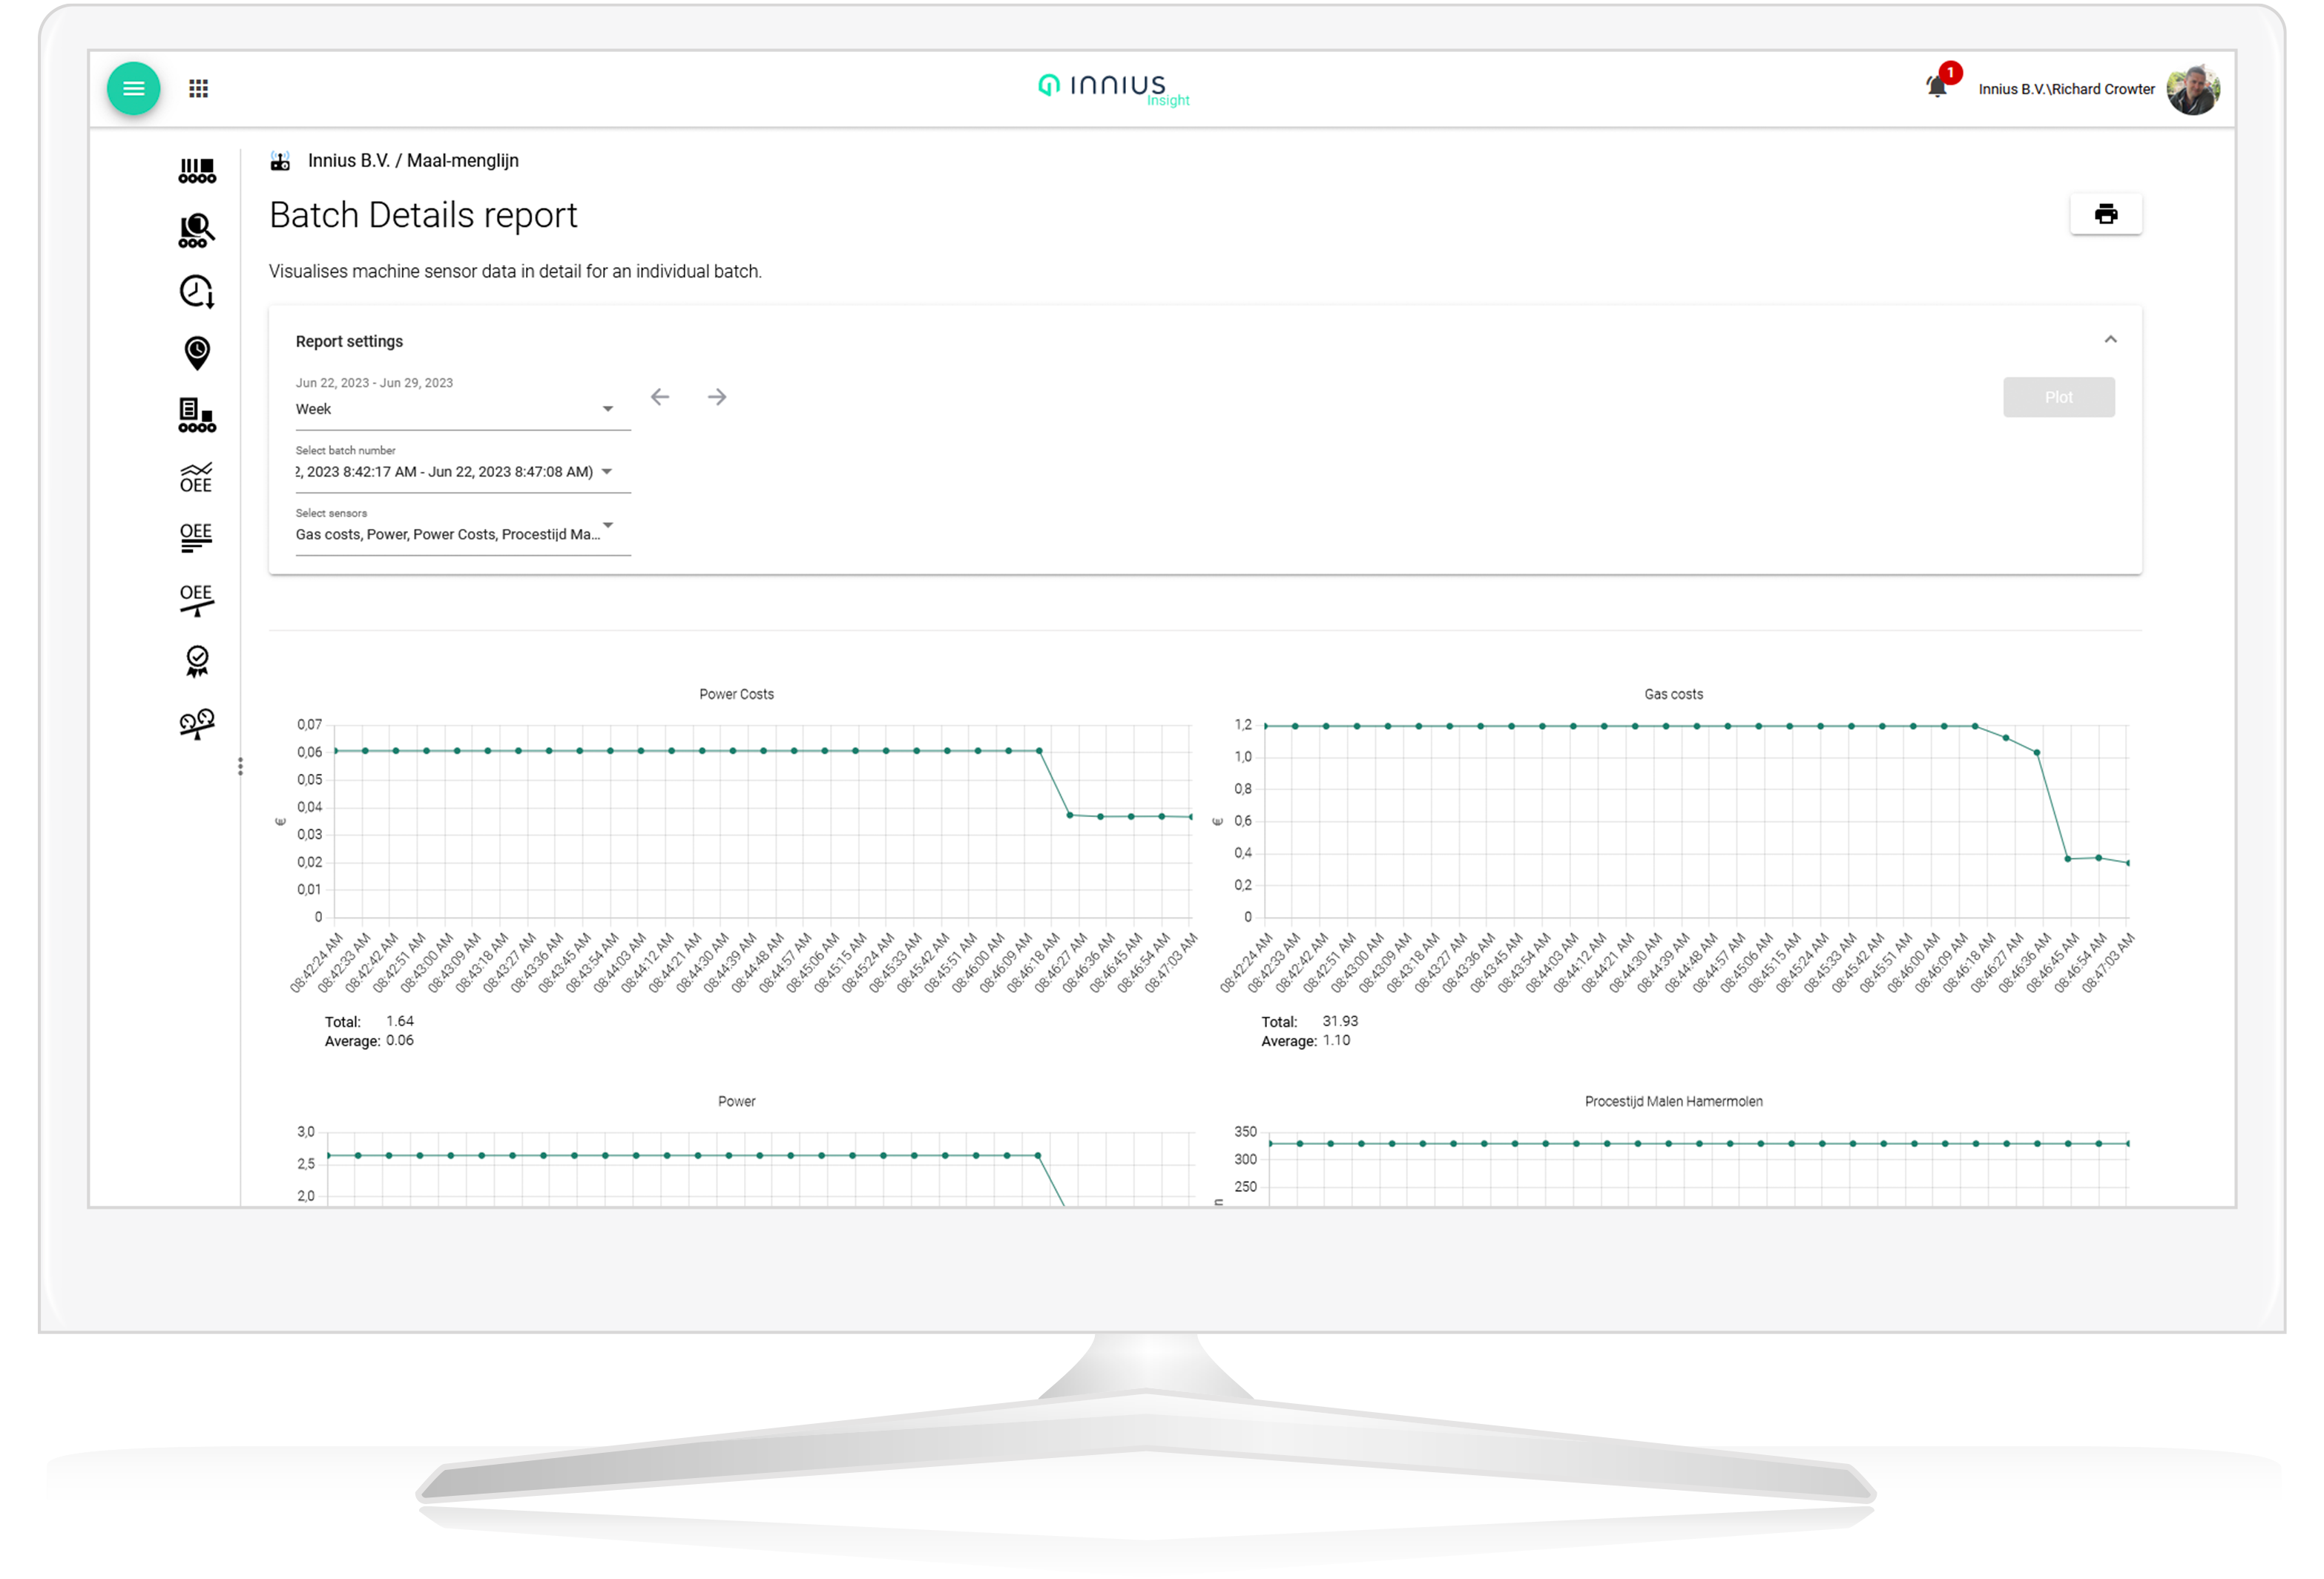
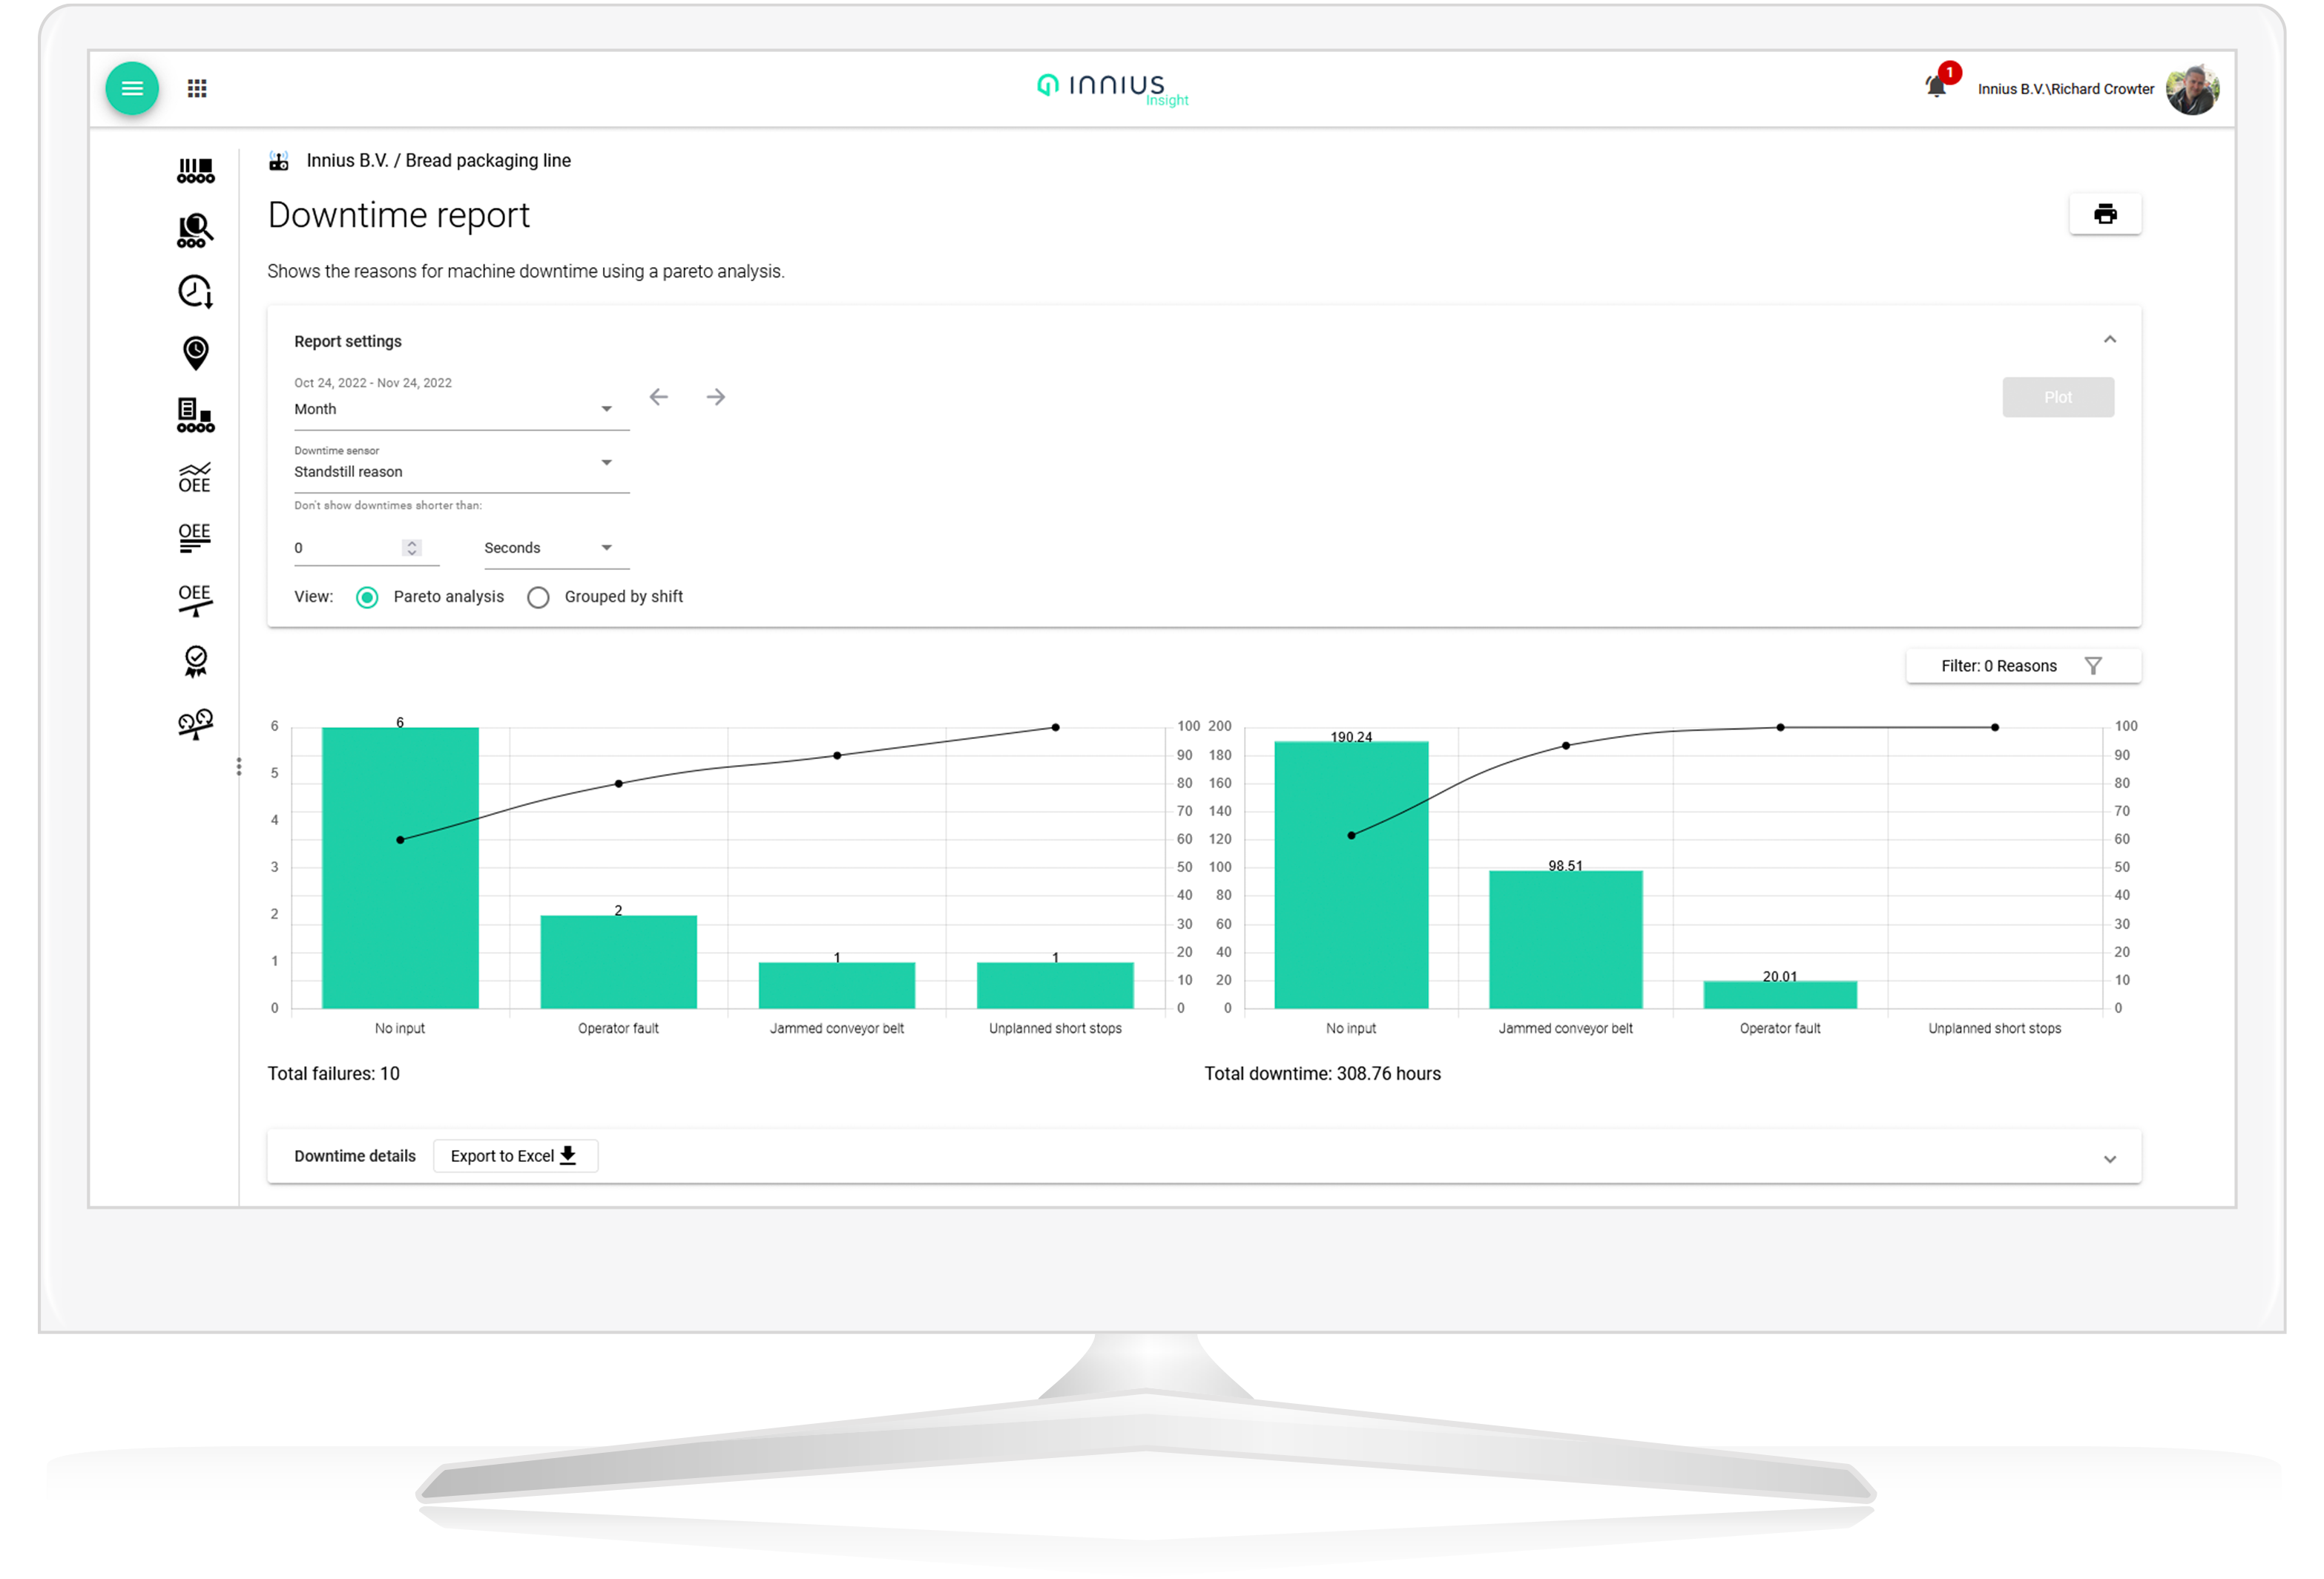
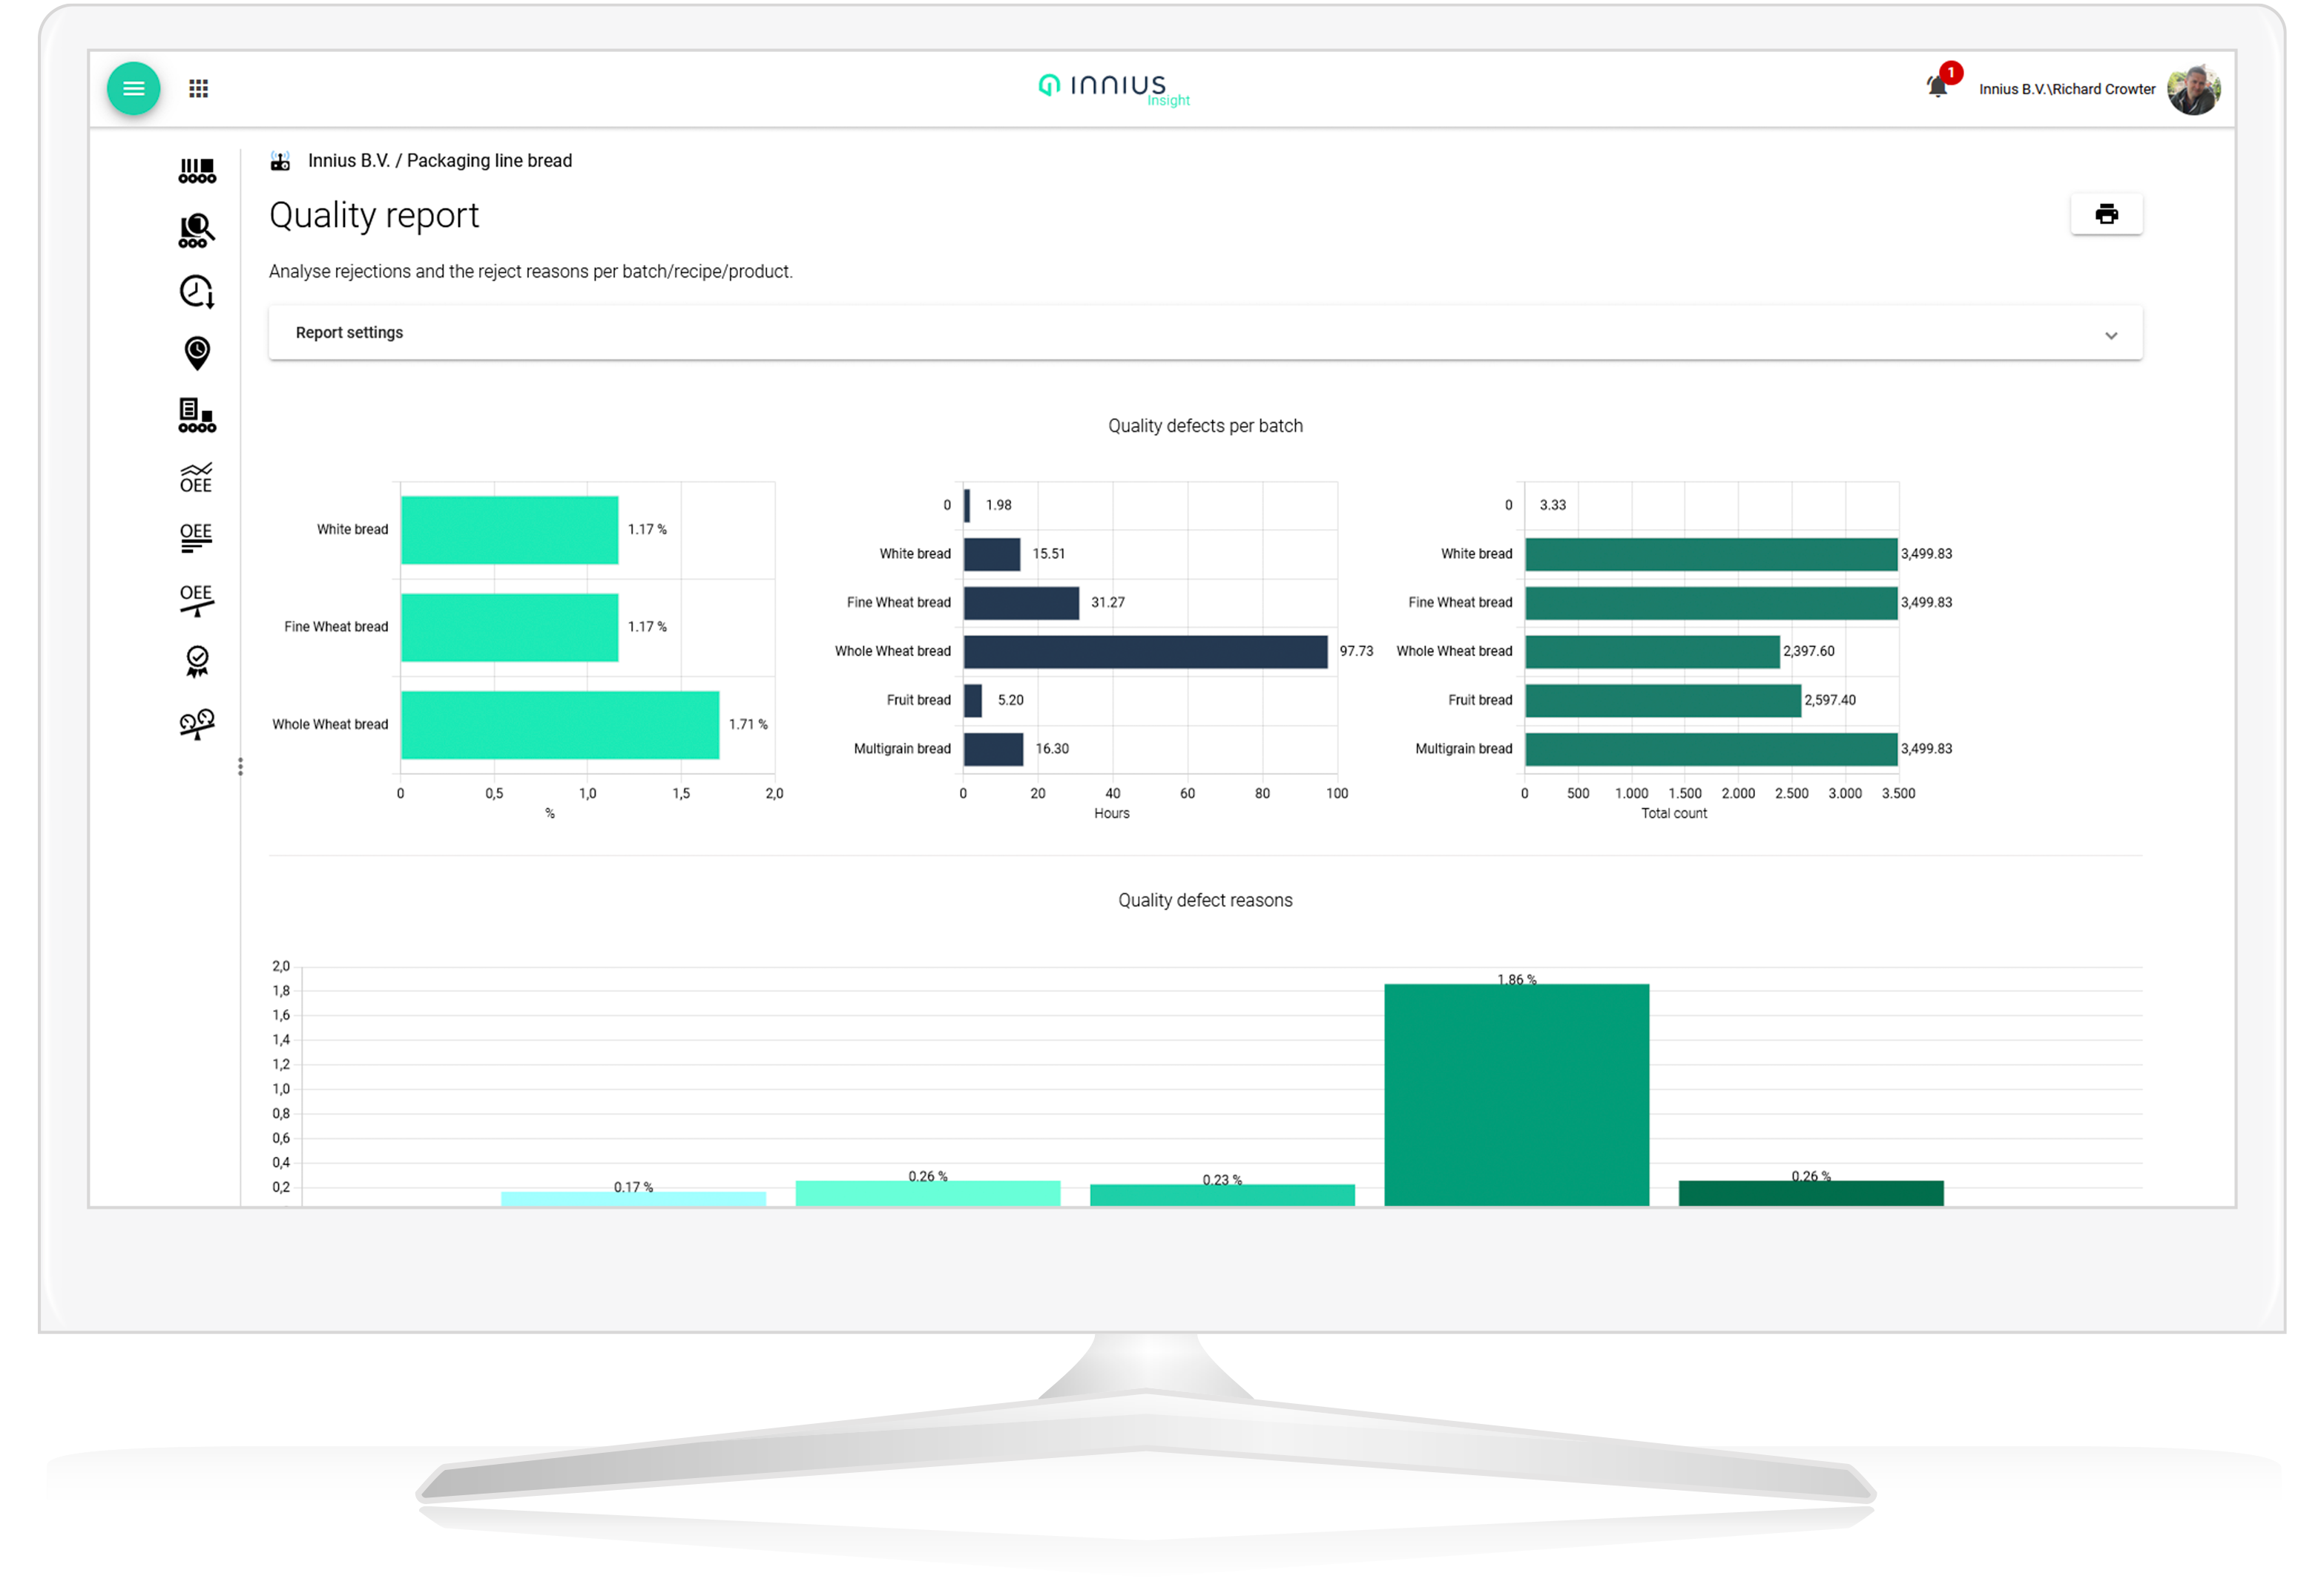
The innius Insight app
The innius Insight app is available for some innius users and can be used either via a web browser or on mobile and tablet devices with our native Android and iOS apps.
The app is structured around machine profile pages, which each have a timeline of events and overview of the machine’s condition. Sensor and KPI data is made accessible in real-time with clearly organised tiles, graphs, and timelines. Data monitoring is also made actionable with push notifications, assigned tasks, and chat functionality. Other machine related information such as documents and media, its location, related conversations and properties can also be viewed here.
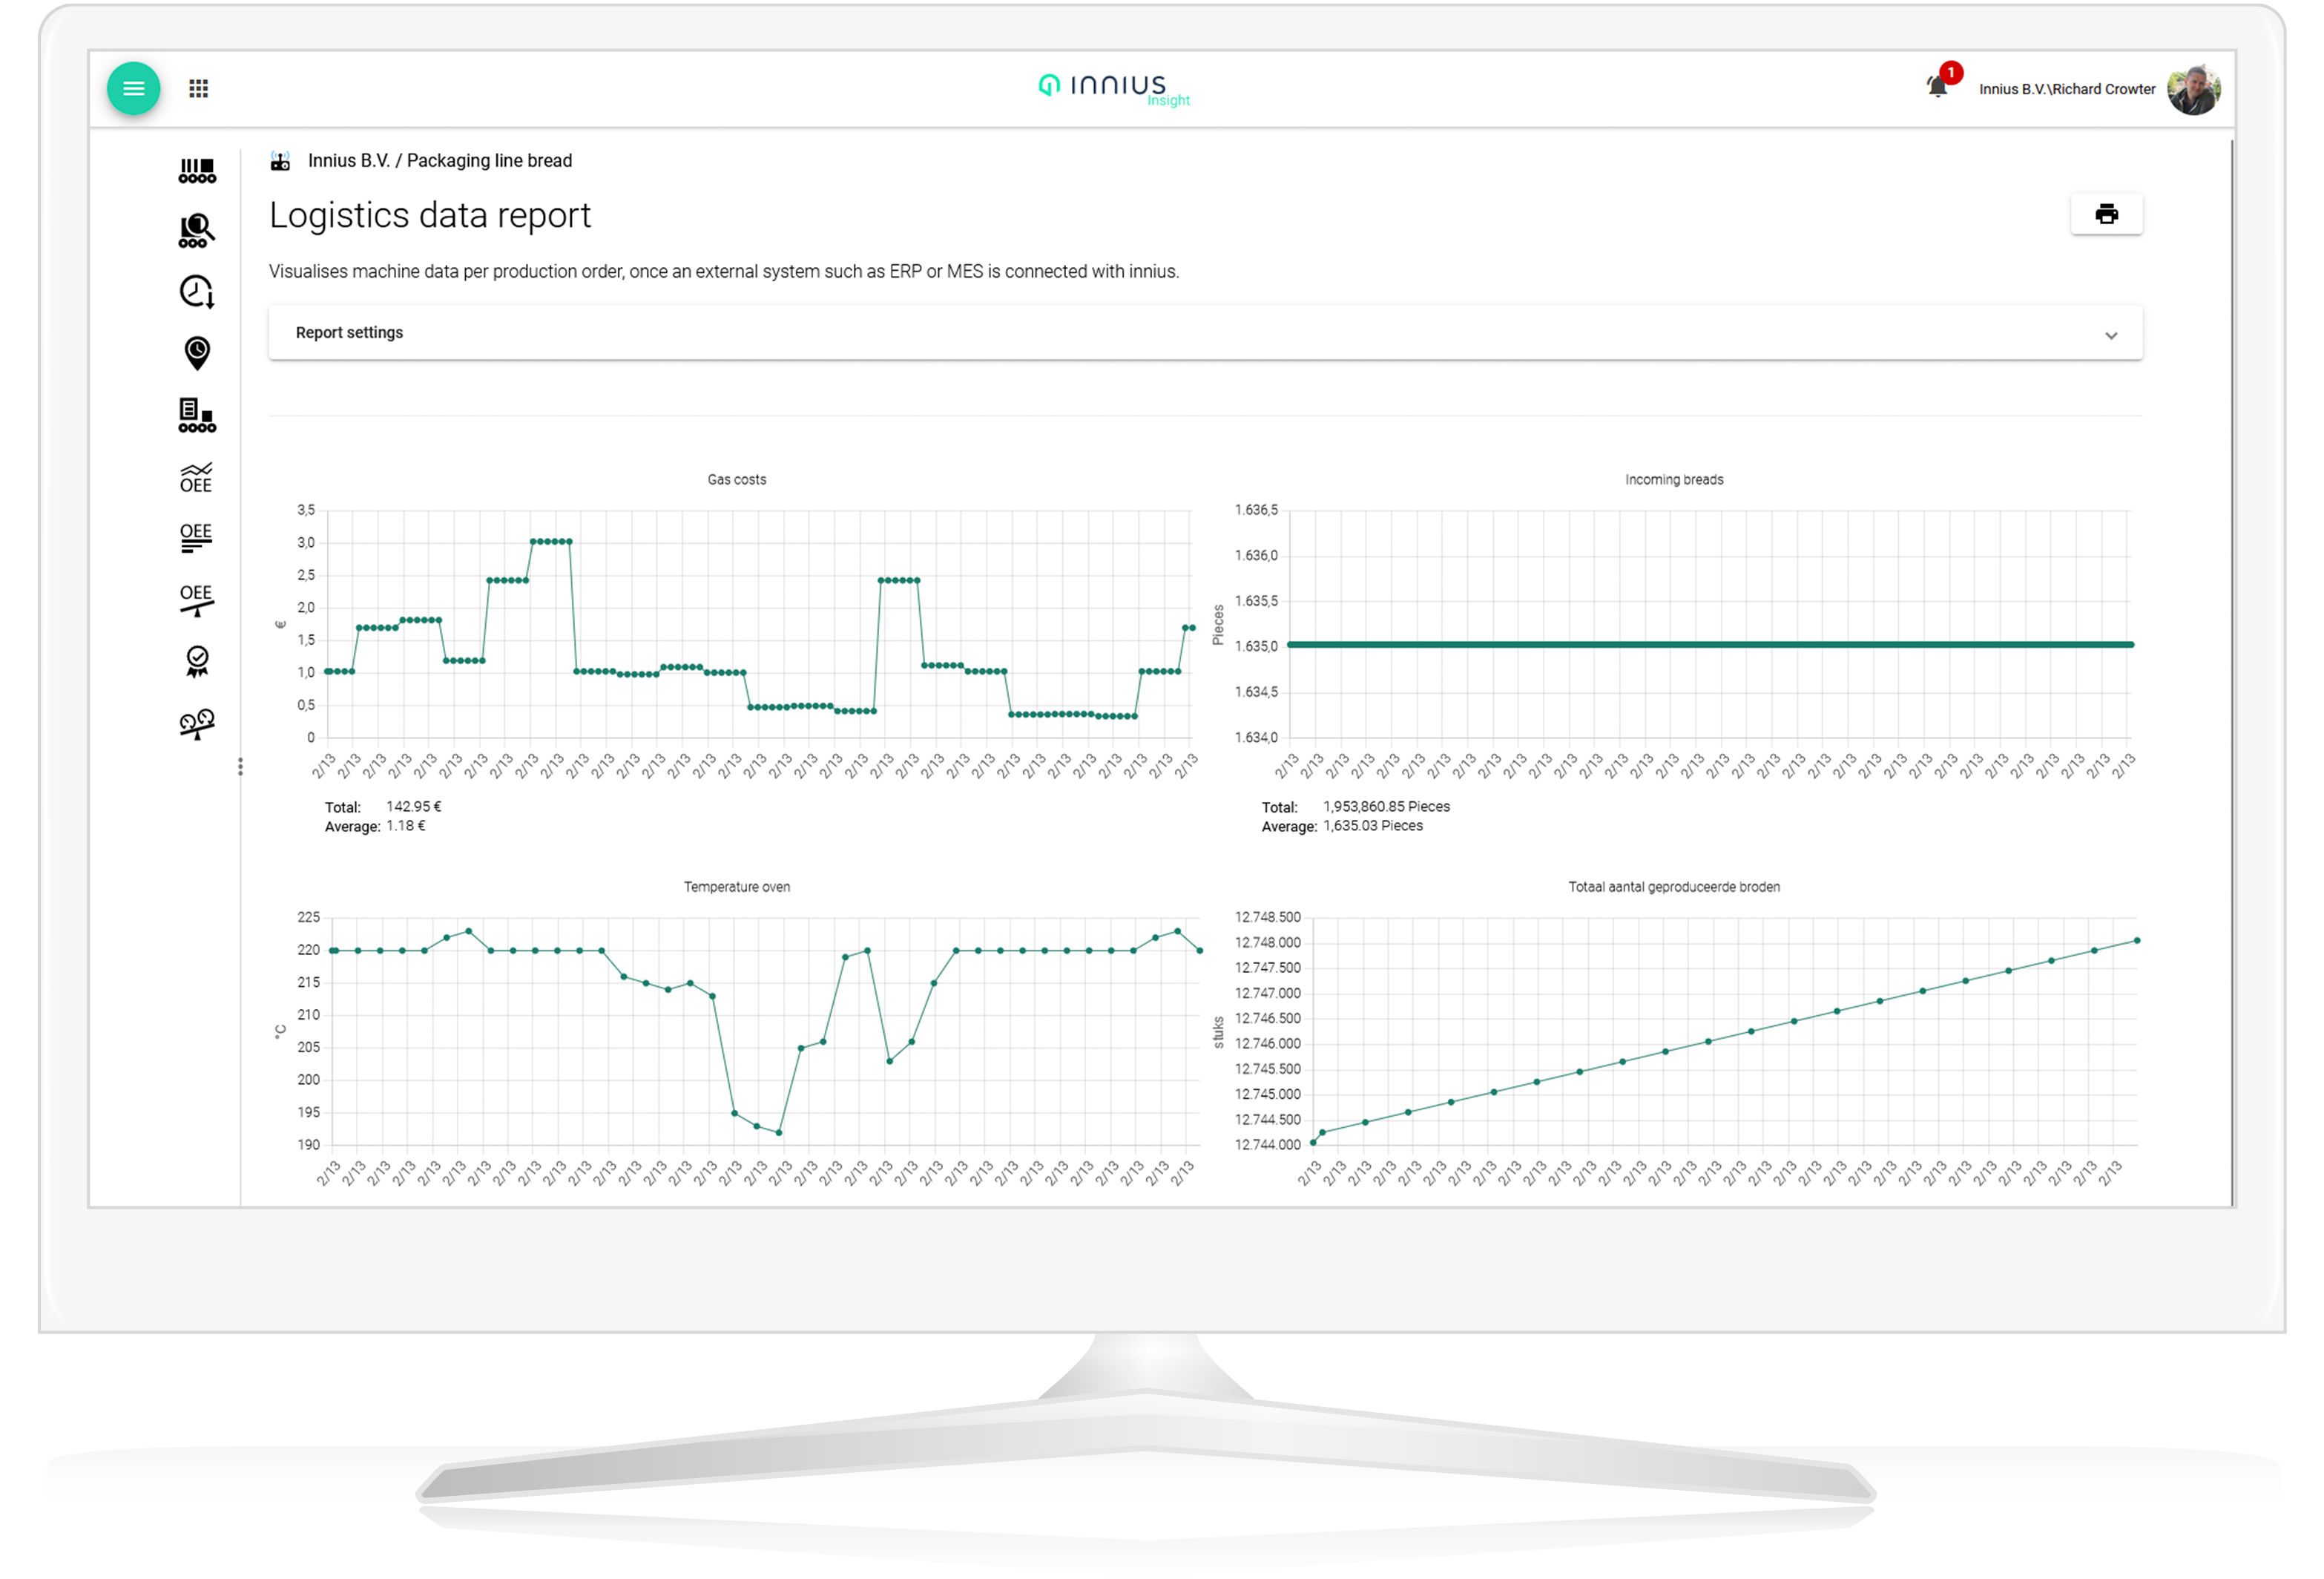
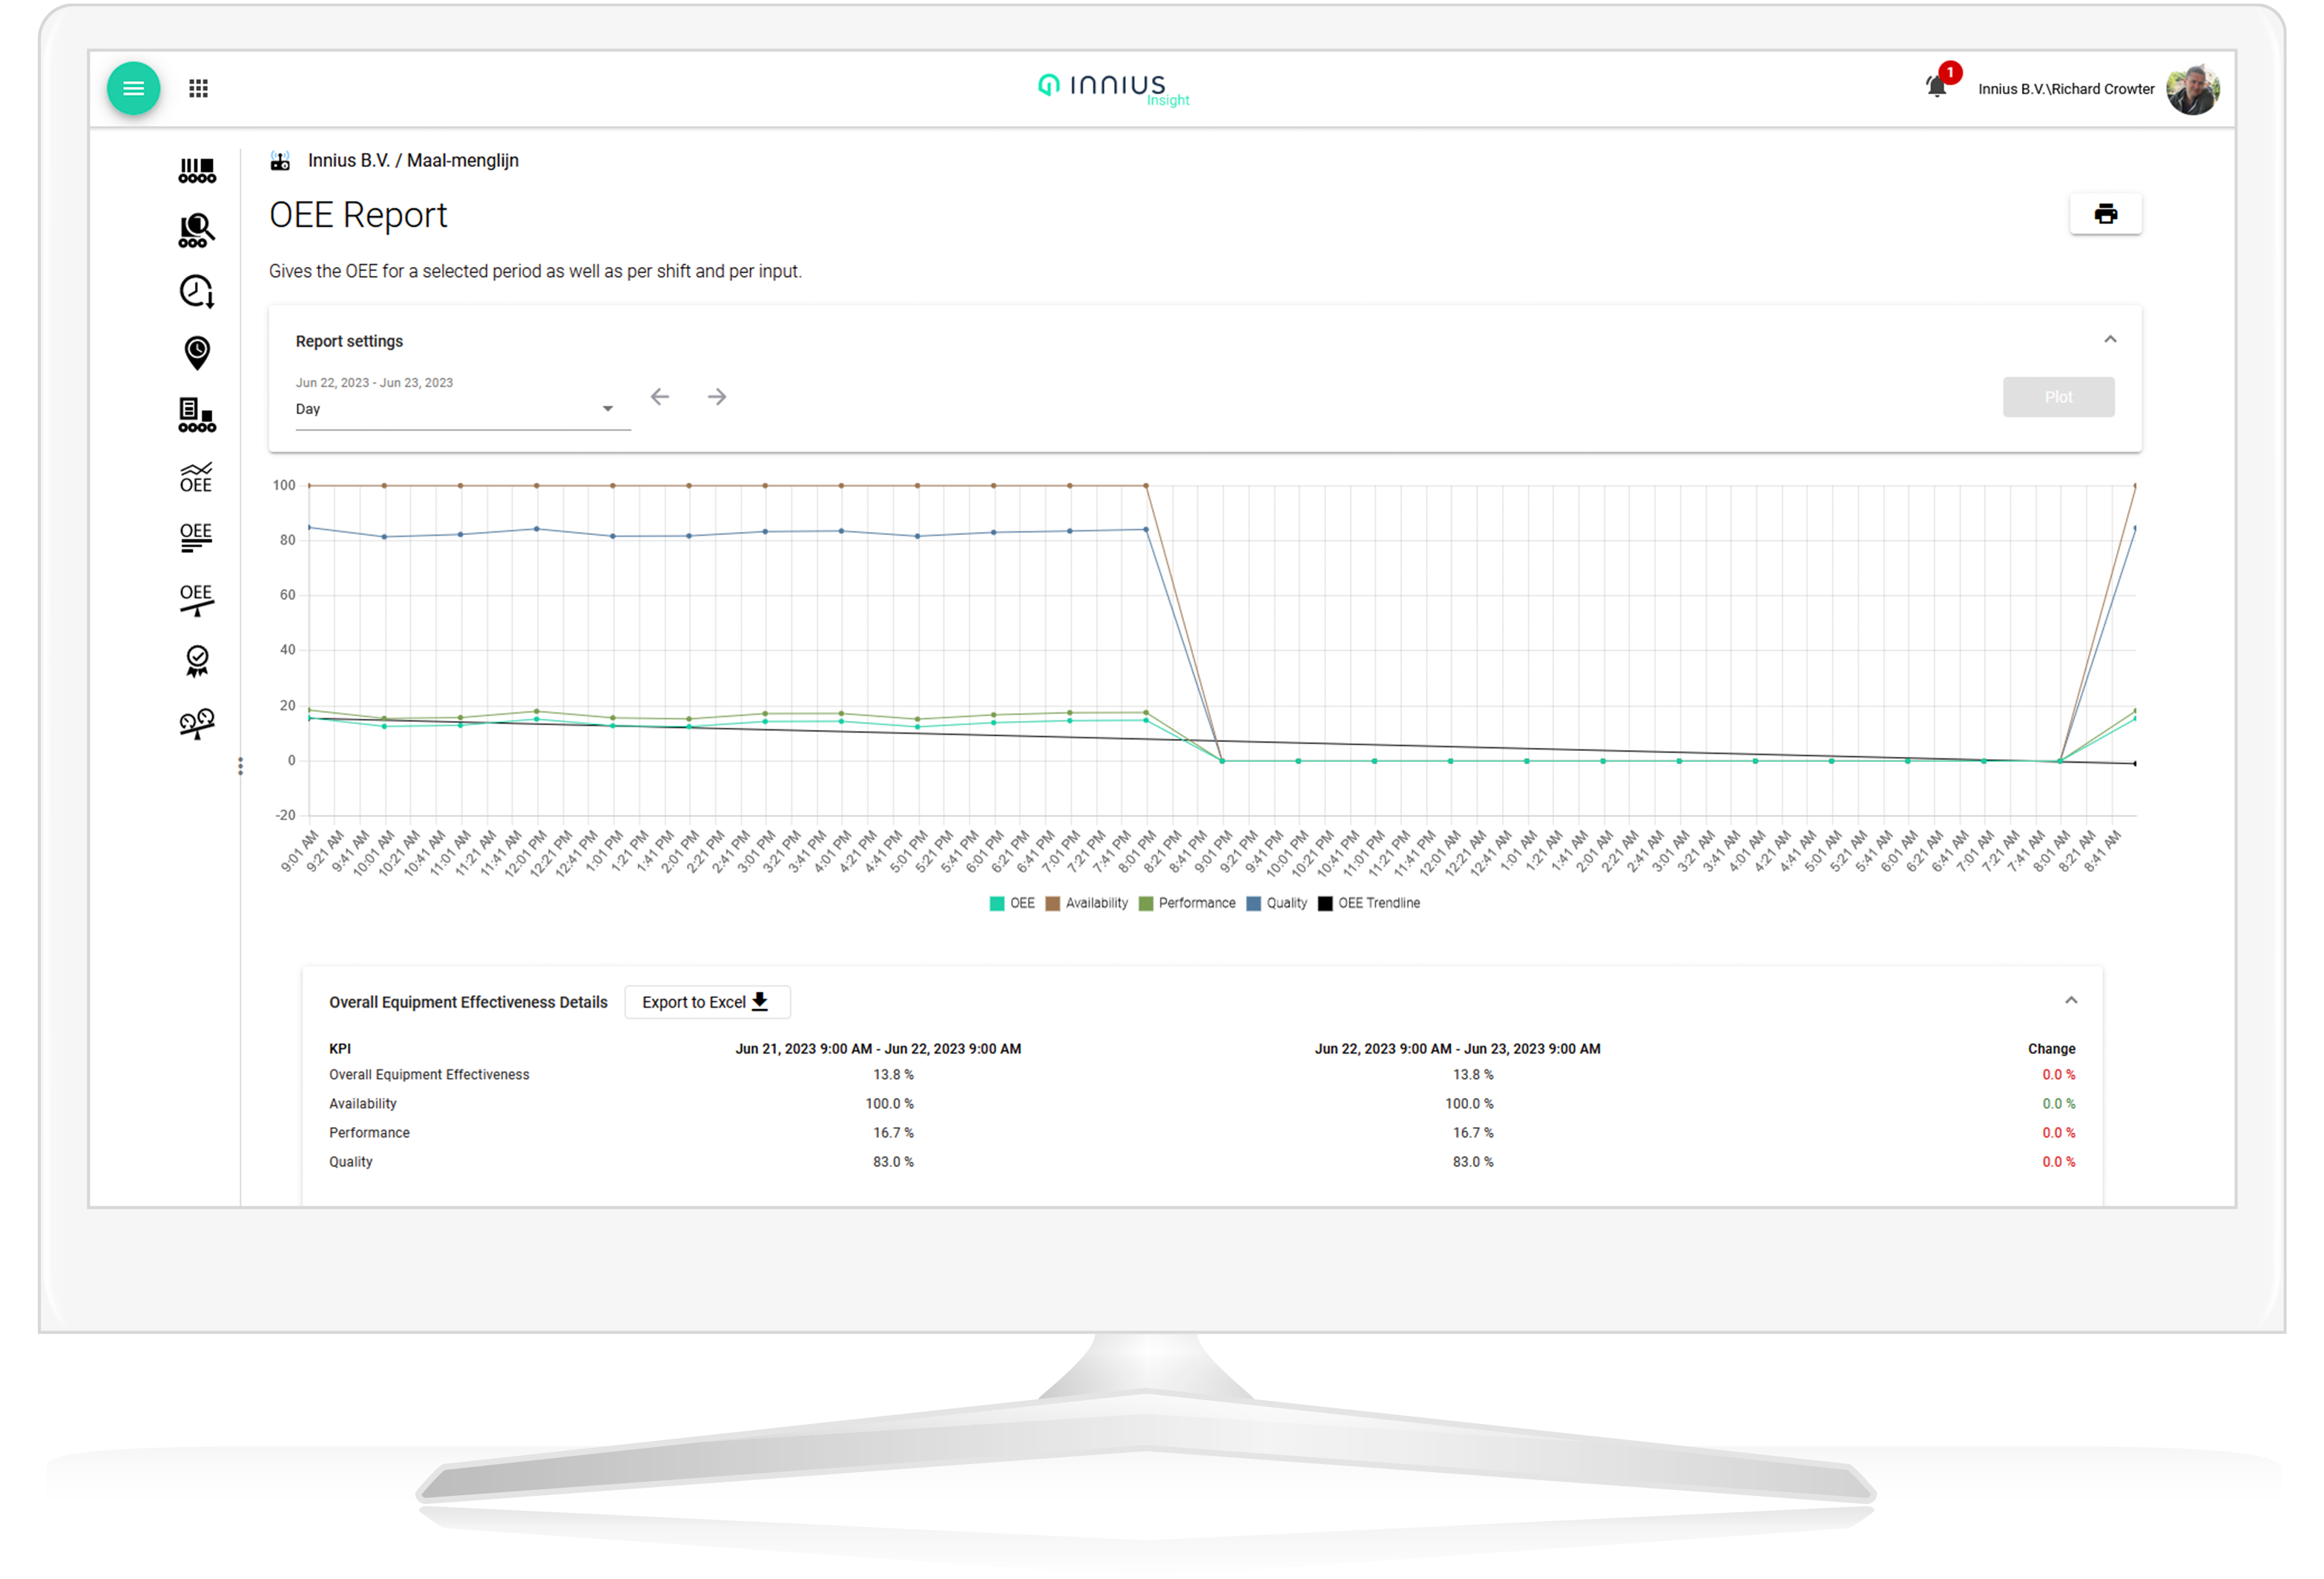
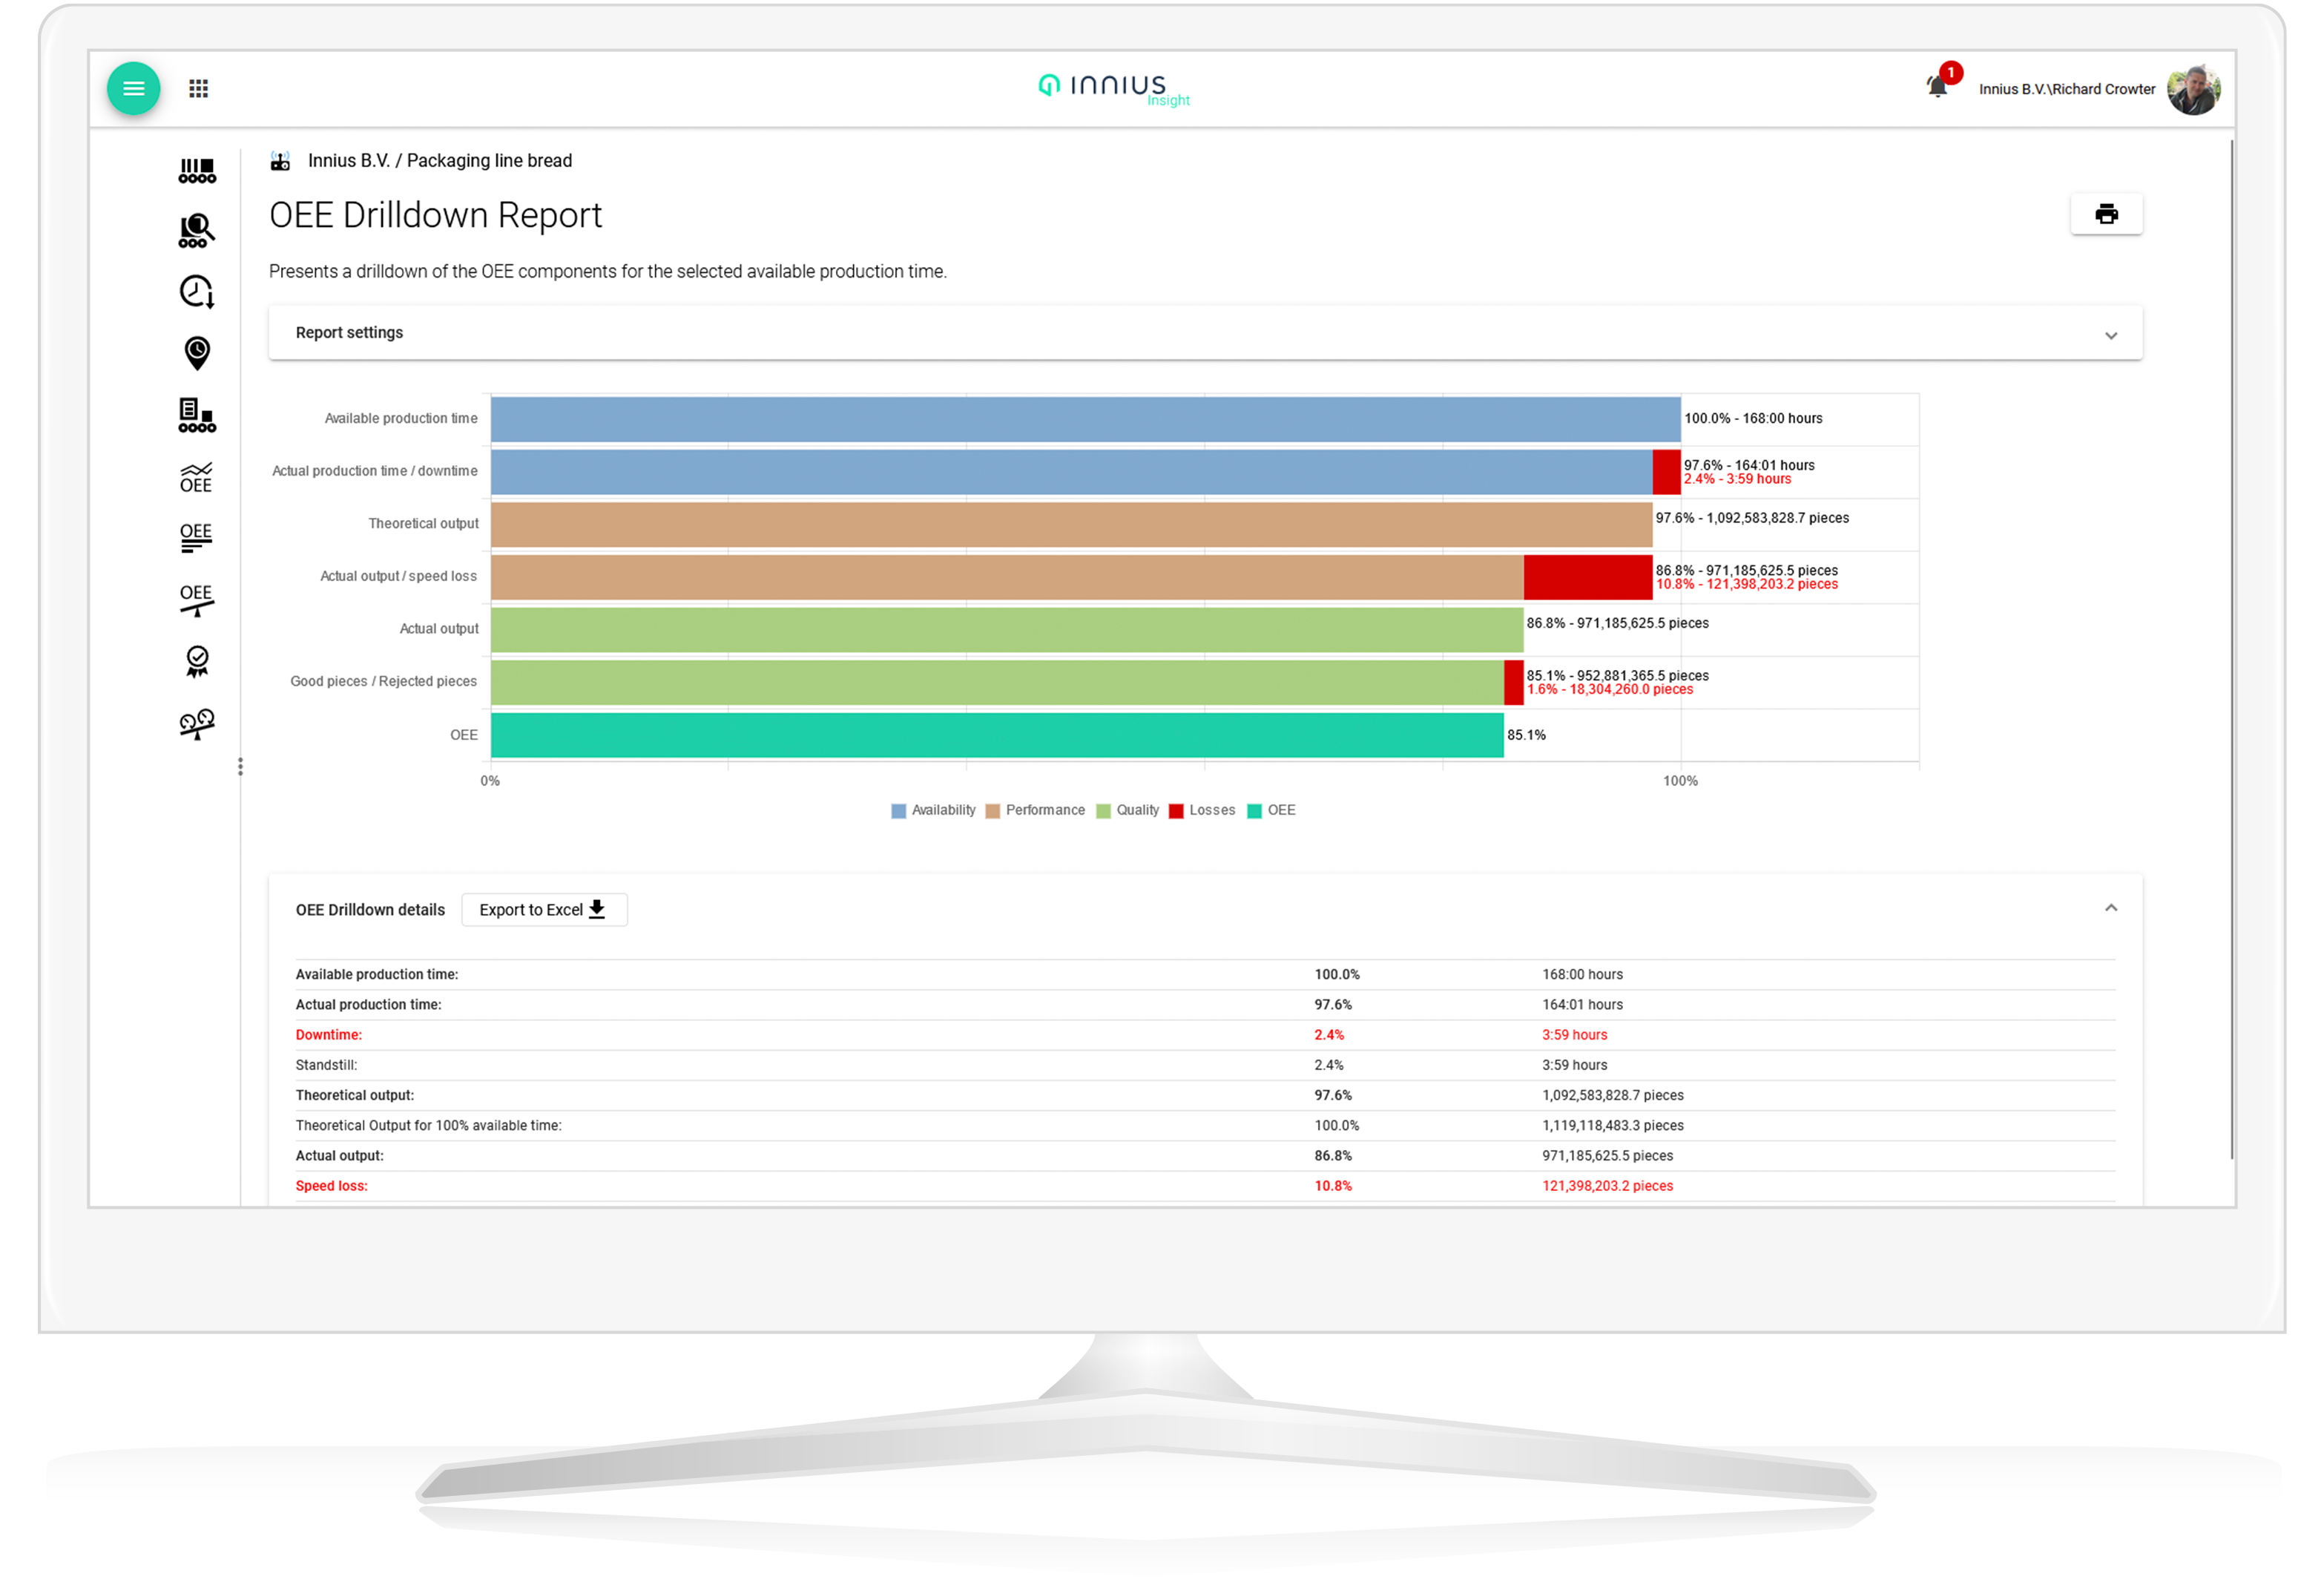
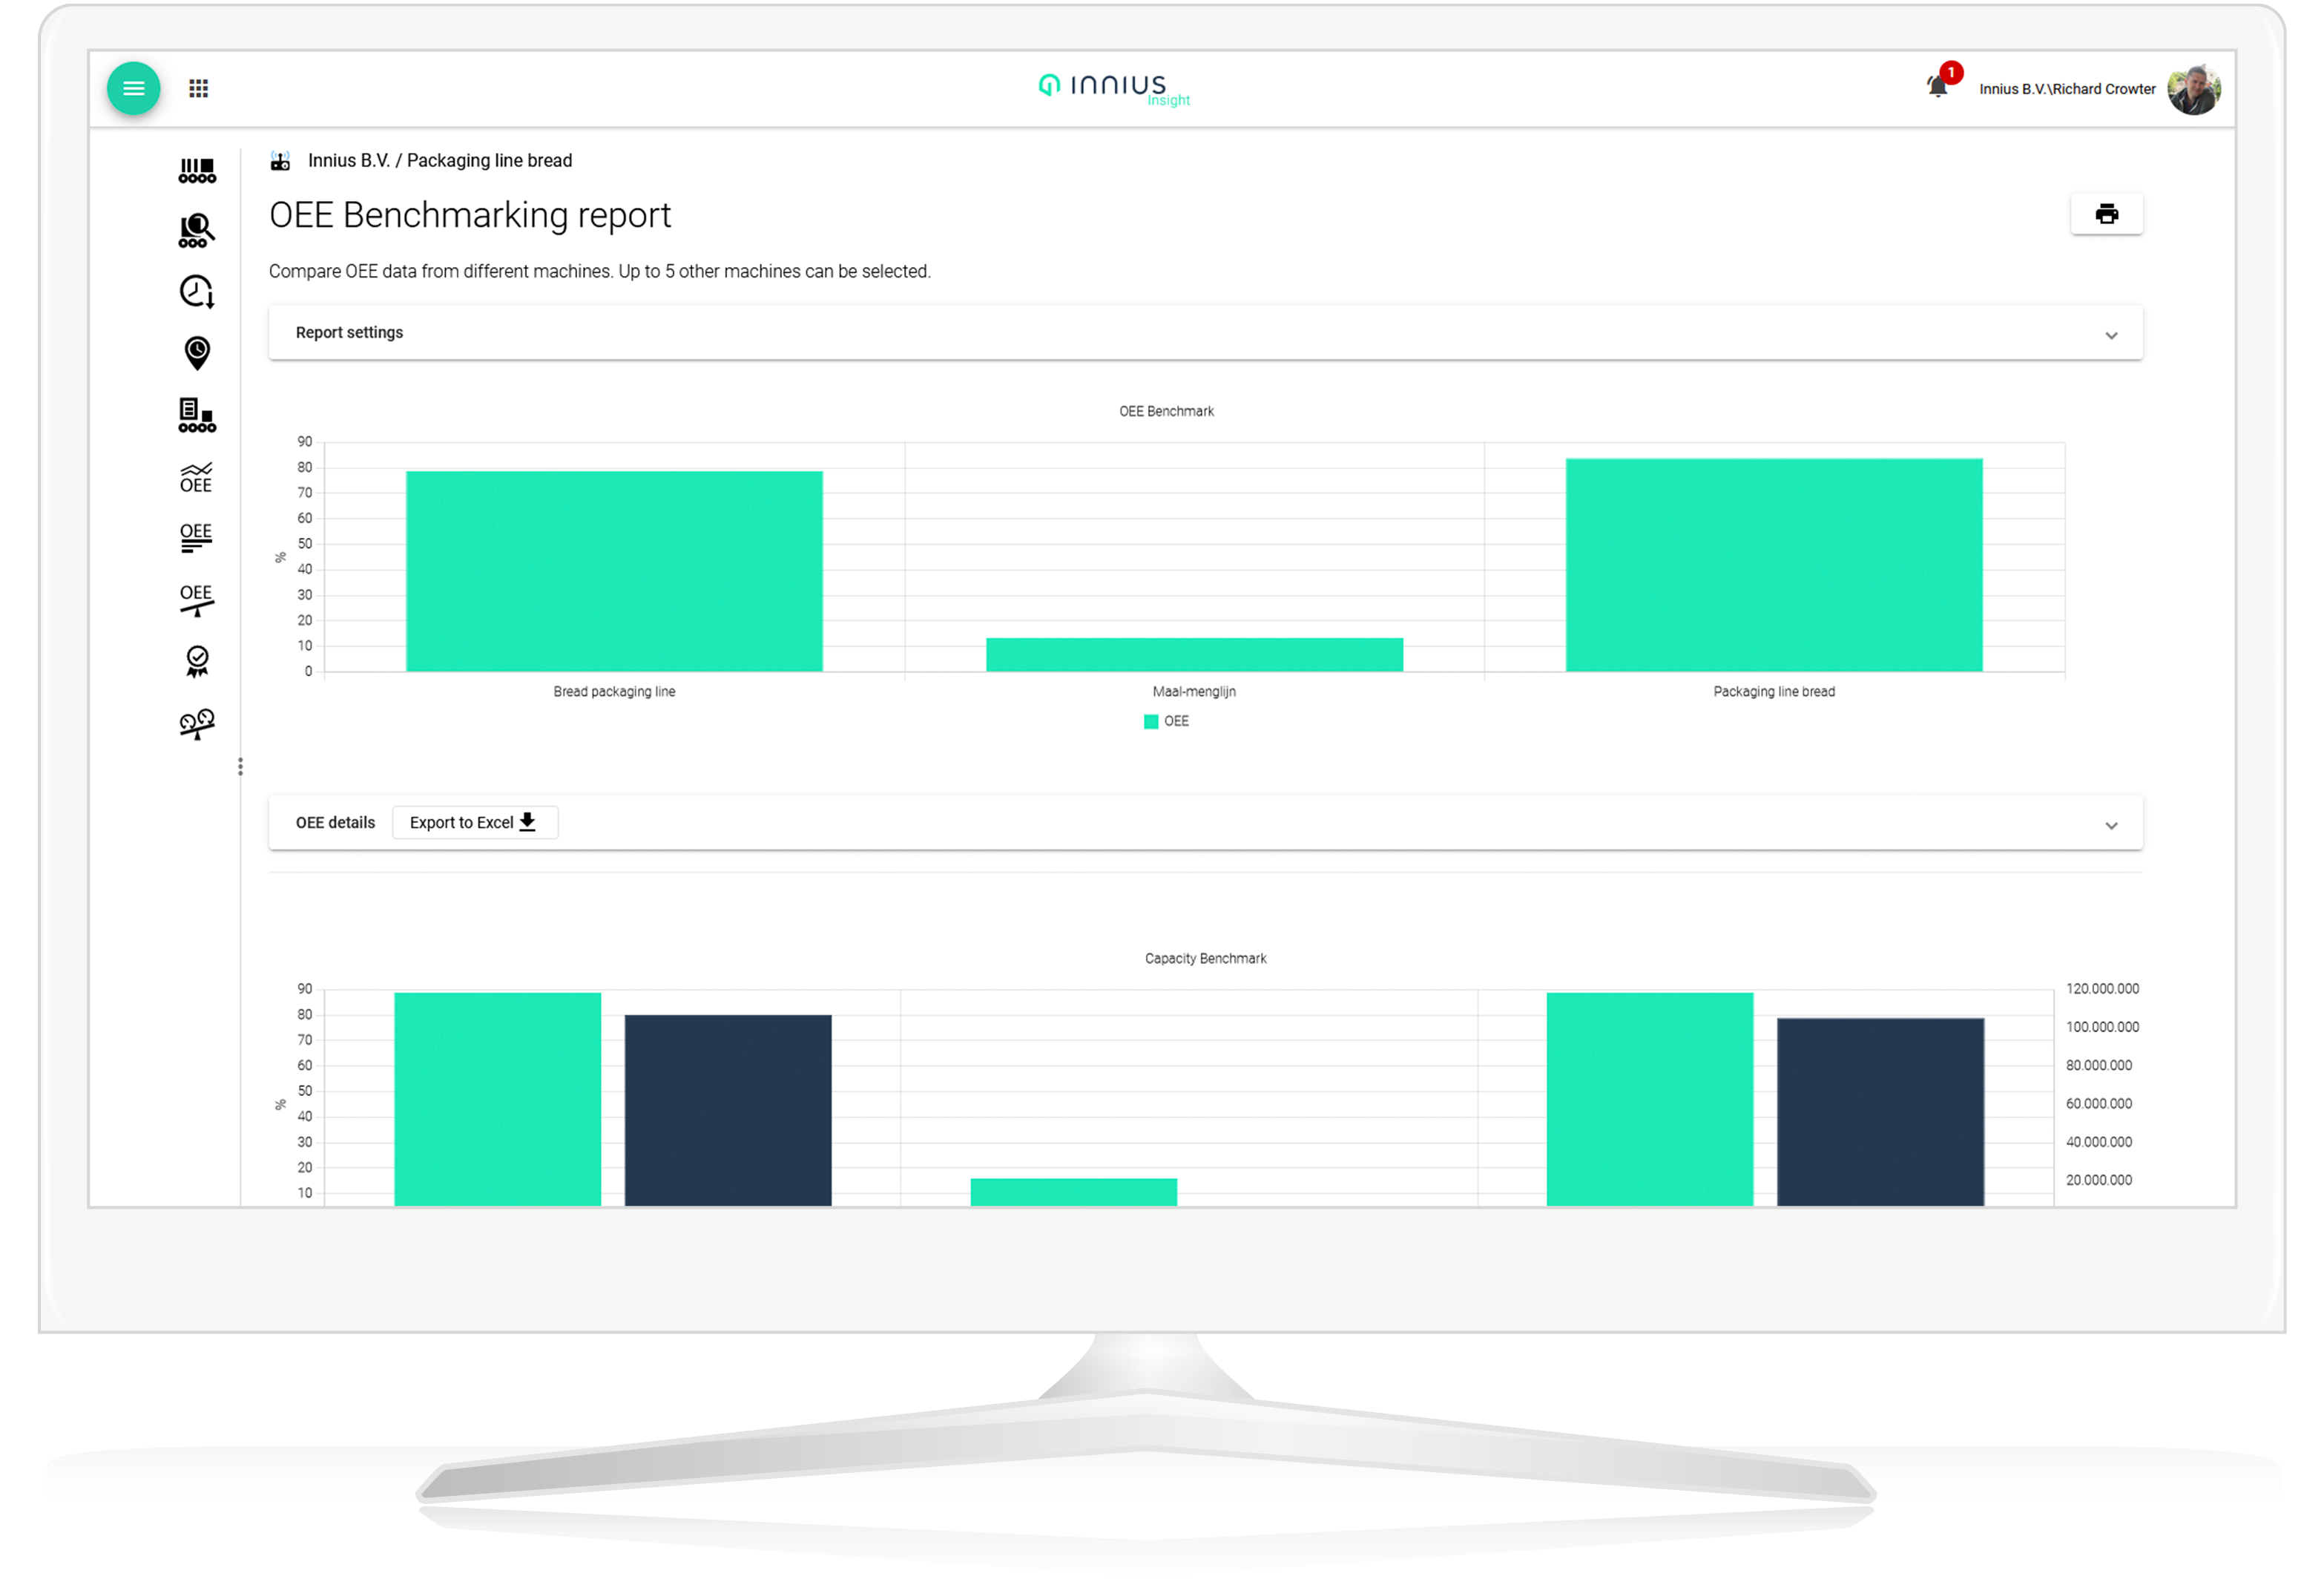
Deeper analysis can be made in the Insight app with the following reports:

You can download the innius Insight app for Android from the Google Play store here and for iOS from the Apple app store here.

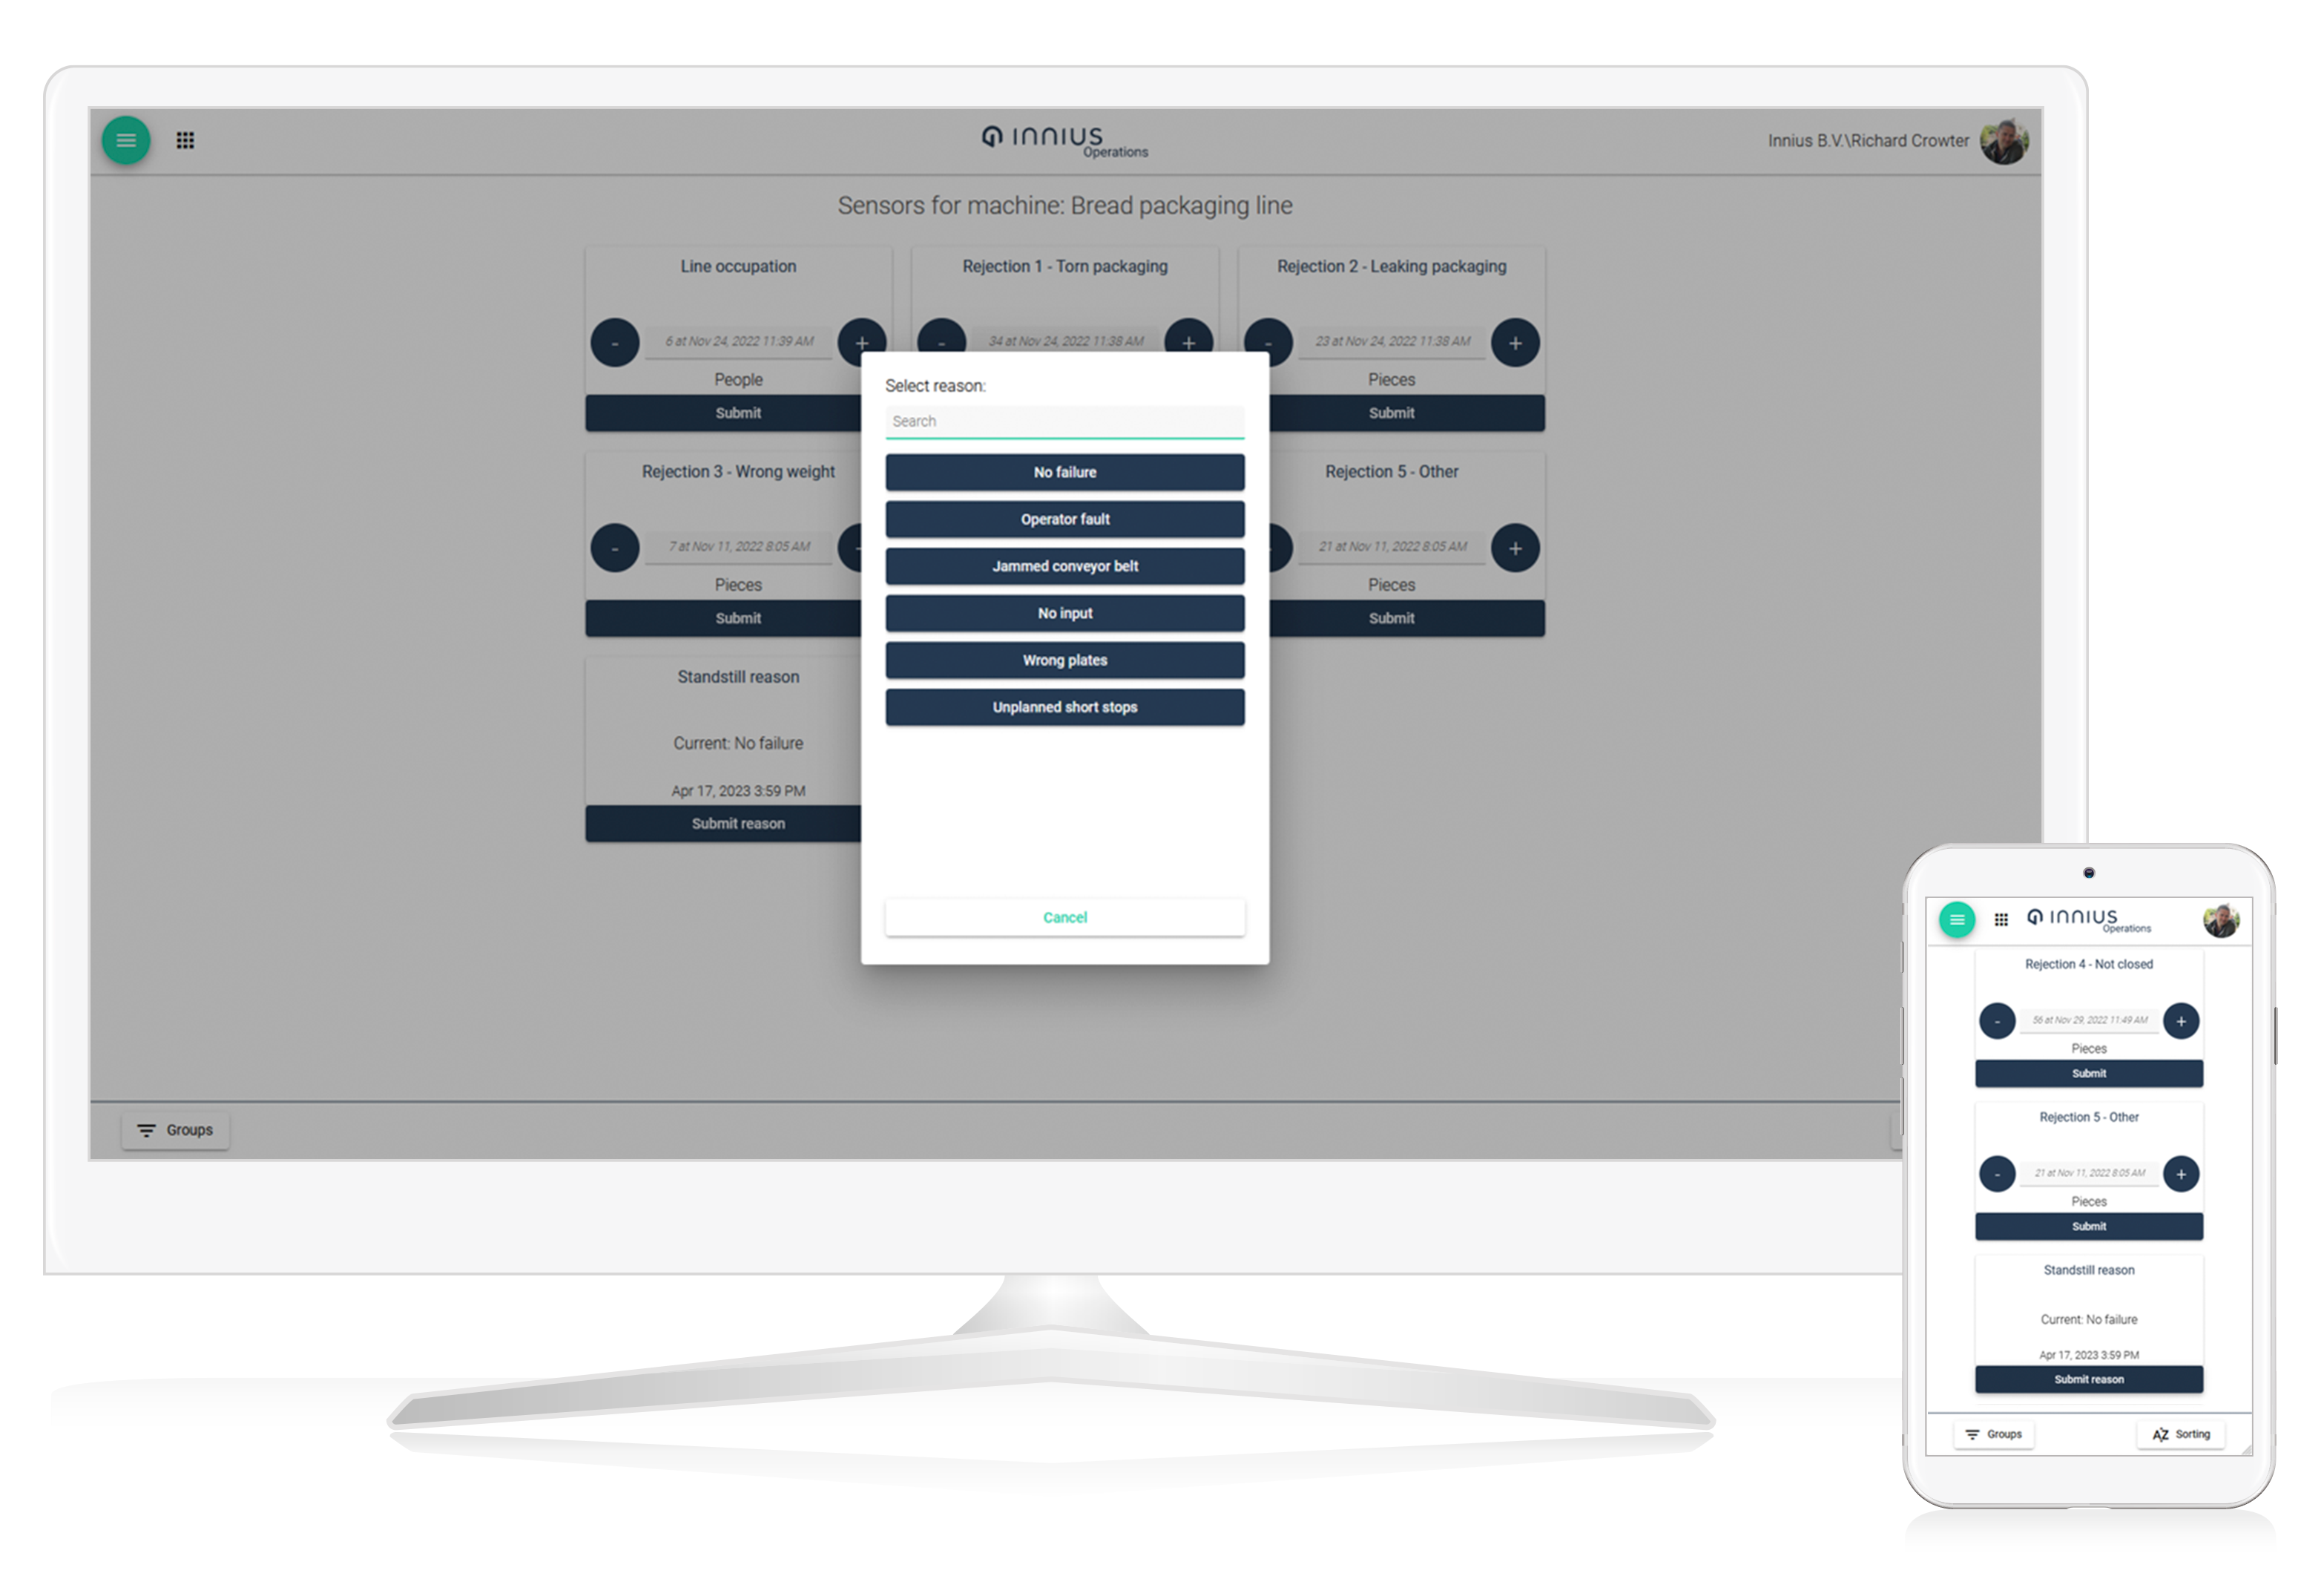
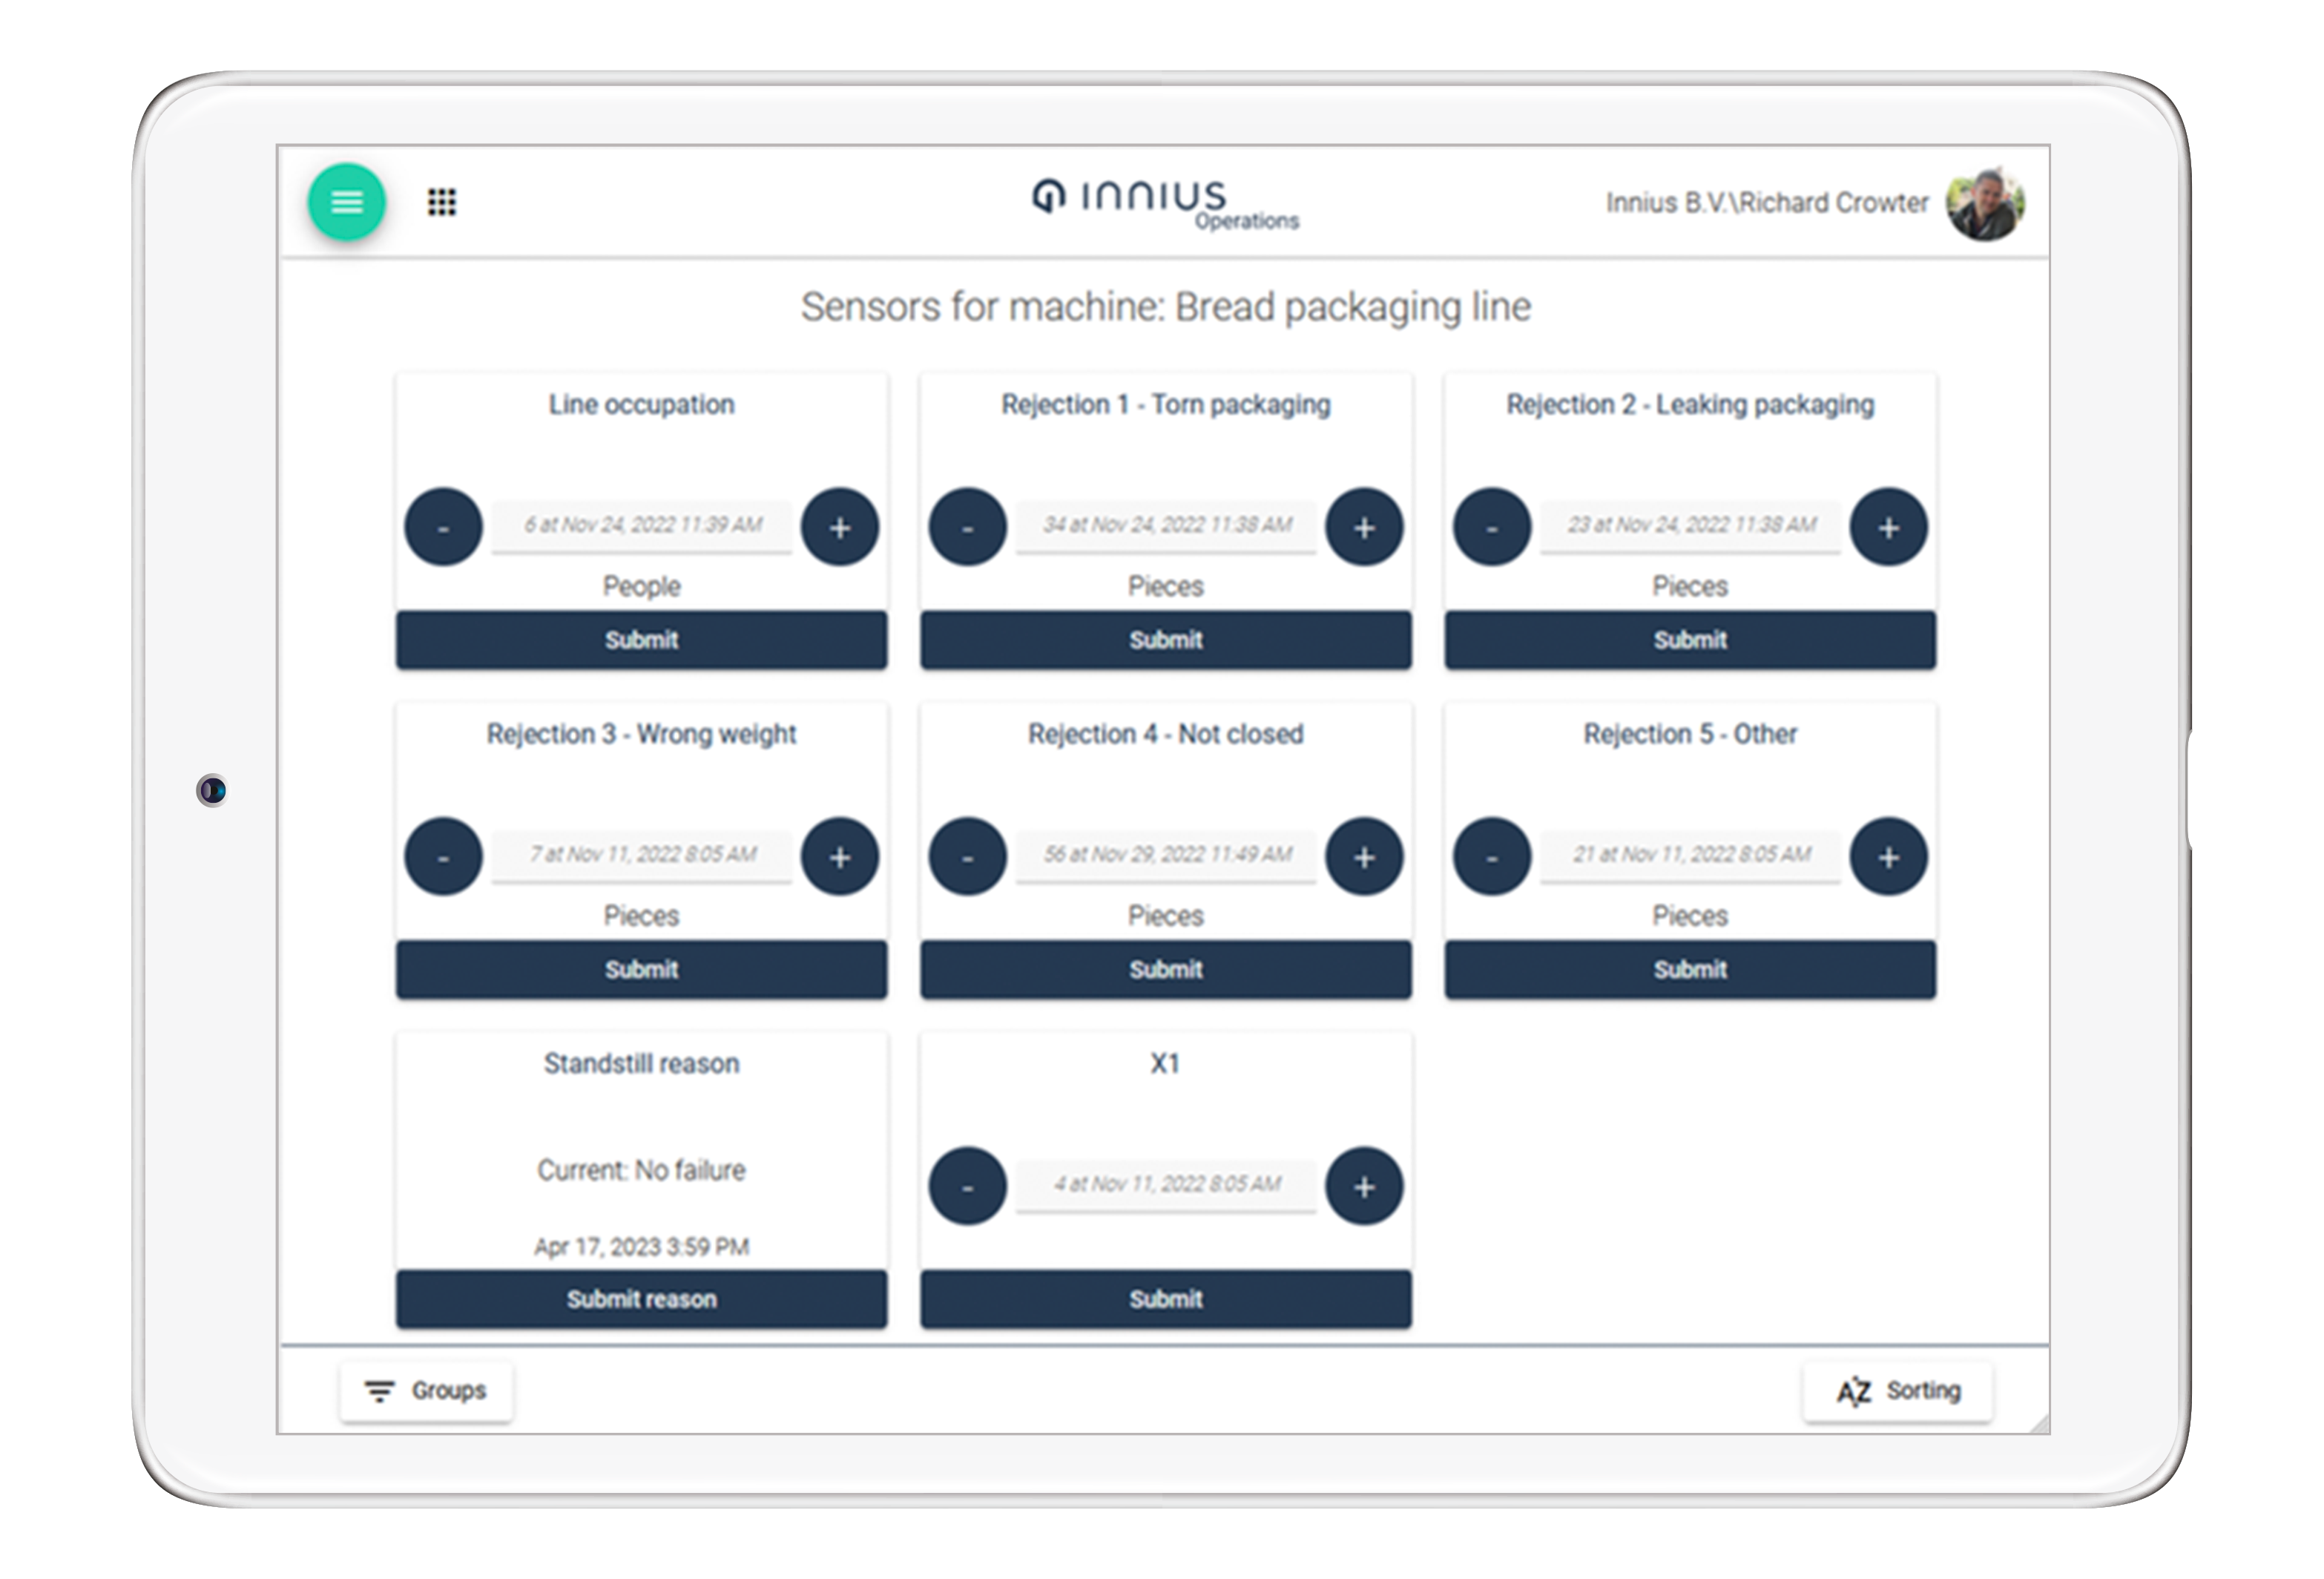
The innius Operations app
The innius Operations app is available for all innius users and accessed via a web browser. It enables both the submission of downtime reasons and the manual input of data for manual sensors. To facilitate this the app has been optimised for touch screens on tablets and mobile devices. This is ideal for setting up next to a production line for example and tracking the reasons for short stop downtime and the registration of quality defects. It can also be used to input data via a barcode scanner. It is available in English, Dutch and French.


Which innius journey suits you best?

![]()