Energy Efficiency

Energy management starts with monitoring

Energy Monitoring Dashboards on mobile and tablet
 

Pump motor which consumes energy in a process production line

Real-time energy monitoring

How much energy does your production process use? How much is used to make compressed air, steam and other utilities? And what are the real costs of this consumption? Where can savings be made? How much CO₂ do you generate during my production process? Answers to these questions can be achieved with real-time monitoring of the consumption on the production line and the utilities in your factory with the help of innius. Innius provides these answers via standard KPIs, notifications, insight into consumption and costs and insight into where savings are possible. Monitoring energy consumption with innius gives you a tool to understand the consumption of electricity, gas, water or steam and to identify areas for improvement.

How to get control of consumption and emissions?

*This brochure is in Dutch

Discover the innius Industrial IoT approach

  • Real-time energy efficiency and CO₂ insights
  • Detects process deviations
  • Continuously optimizes the process
  • Applies to electricity, gas, water & steam
  • Achieves sustainability goals
  • Complies with EED energy audit
 

Success strategy

In a joint approach with our partner Pontifexx, we achieve the desired insight into energy consumption and CO₂ emissions, provide insight into where savings are possible and achieve and guarantee these savings for you.

In this video (in Dutch) we show you this approach.

What if you are asked about your energy policy ?

Ready for the EED audit?

Sometimes less energy generates more results

Optimize any machine with smarter energy management

This is how we do it

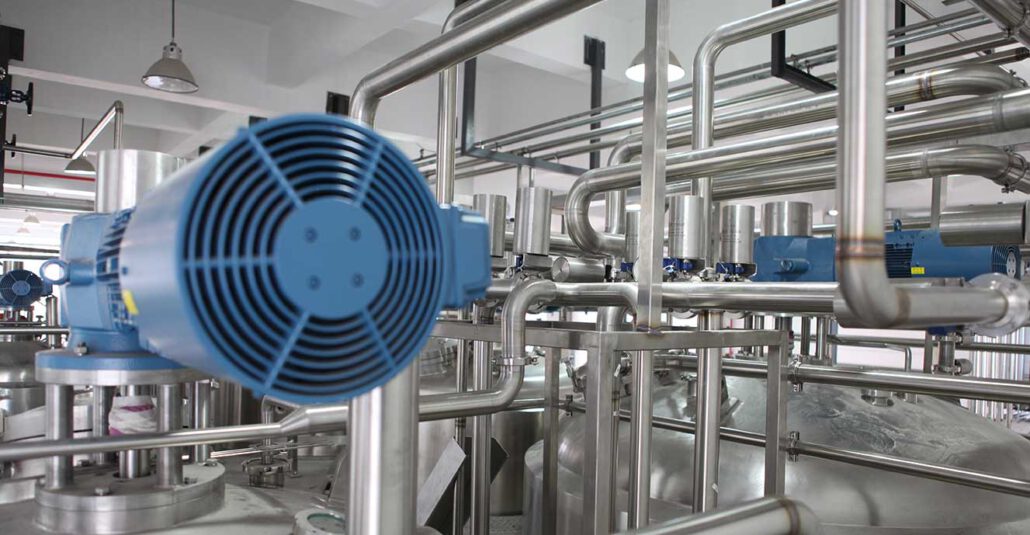
We install sensors to control and monitor the production process. The offers enormous possibilities in analysis and monitoring. Our approach explained in six steps.

Energy Icon Step 1

The energy sources and the associated measuring points are determined.

Energy Icon Step 2

The measuring points of the energy flows are mapped.

Energy Icon Step 3

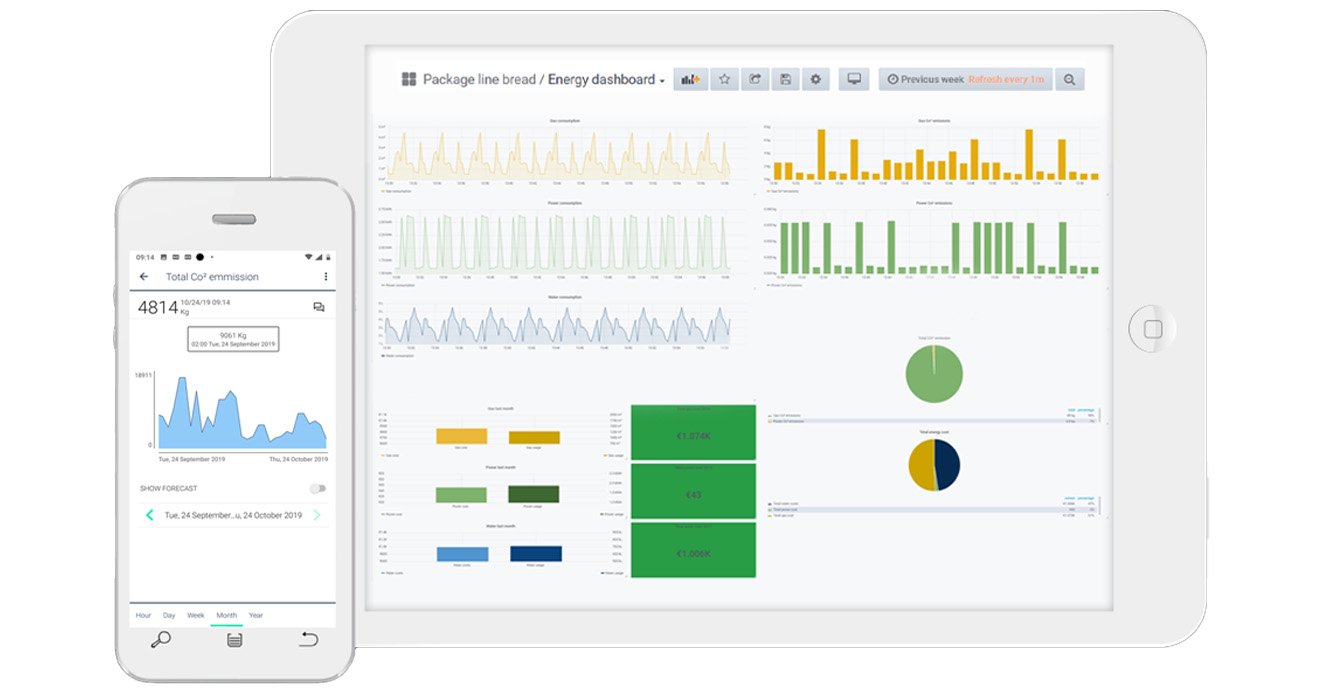
The measuring points are connected to the innius platform. This provides detailed real-time insight into your consumption and CO2 footprint.

Energy Icon Step 4

This insight is shown to you via our apps, via smart KPIs and straightforward dashboards.

Energy Icon Step 5

Periodic analysis studies look at the effectiveness and efficiency of consumption and identify deviations.

Energy Icon Step 6

These analyzes form the basis for improvements. Because the consumption is measured in real-time, there is direct insight into the realized savings.

These companies already work with innius®

Logo for Grimbergen, an innius customer
Logo for Johma, an innius customer
Logo for ERU, an innius customer
Logo for LeDuc Fine Foods, an innius customer
Logo for Pandriks, an innius customer
Logo for TenCate, an innius customer
Logo for Alcomij, an innius customer
Logo for Hellema, an innius customer
Logo for Freudenberg, an innius customer
Logo for Lekkerkerker Groep, an innius customer
Logo for Itho Daalderop, an innius customer
Logo for Tronrud Engineering, an innius customer
Logo for Floating Solar, an innius customer
Logo for Lantor, an innius customer
Logo for For Farmers De Hoop, an innius customer

The other benefits of innius…

Innius Productivity Icon in Teal

Increased
Productivity

Innius Quality Icon in Teal

Better
Quality

Innius Maintenance Icon in Teal

Smart
Maintenance

Innius Food Waste Icon in Teal

Reduced
Waste

Richard Crowter, UX Designer & Marketing Coordinator at innius

Curious what innius means for your business?

This is Richard, he’s happy to advise you! Please fill out the form and he will be in touch!

  • By clicking 'Submit' you agree with our privacy policy.
  • This field is for validation purposes and should be left unchanged.